|
Download Data (XLS File) |
|
||||||||
|
||||||||
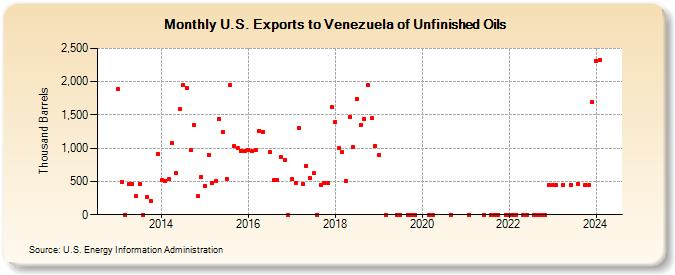
| U.S. Exports to Venezuela of Unfinished Oils (Thousand Barrels) | ||||||||
| Year | Jan | Feb | Mar | Apr | May | Jun | Jul | Aug | Sep | Oct | Nov | Dec |
|---|---|---|---|---|---|---|---|---|---|---|---|---|
| 2013 | 1,890 | 496 | 1 | 455 | 457 | 274 | 463 | 0 | 273 | 204 | 914 | |
| 2014 | 517 | 513 | 531 | 1,074 | 621 | 1,589 | 1,946 | 1,903 | 971 | 1,349 | 275 | 572 |
| 2015 | 439 | 900 | 482 | 505 | 1,445 | 1,241 | 538 | 1,953 | 1,027 | 998 | 955 | 959 |
| 2016 | 974 | 958 | 966 | 1,265 | 1,240 | 936 | 516 | 517 | 869 | 829 | 0 | |
| 2017 | 531 | 475 | 1,298 | 469 | 735 | 552 | 623 | 0 | 451 | 480 | 481 | 1,620 |
| 2018 | 1,399 | 996 | 945 | 505 | 1,474 | 1,011 | 1,743 | 1,354 | 1,440 | 1,945 | 1,447 | 1,035 |
| 2019 | 904 | 0 | 1 | 0 | 0 | 1 | 0 | |||||
| 2020 | 1 | 0 | 0 | |||||||||
| 2021 | 0 | 0 | 1 | 0 | 1 | 1 | ||||||
| 2022 | 0 | 1 | 0 | 1 | 3 | 0 | 0 | 2 | 1 | 450 | ||
| 2023 | 449 | 449 | 448 | 451 | 465 | 450 | 448 | 1,688 | ||||
| 2024 | 2,311 | 2,327 | 1,272 | 915 | 1,096 | 648 | ||||||
| - = No Data Reported; -- = Not Applicable; NA = Not Available; W = Withheld to avoid disclosure of individual company data. |
| Release Date: 8/30/2024 |
| Next Release Date: 9/30/2024 |