|
Download Data (XLS File) |
|
||||||||
|
||||||||
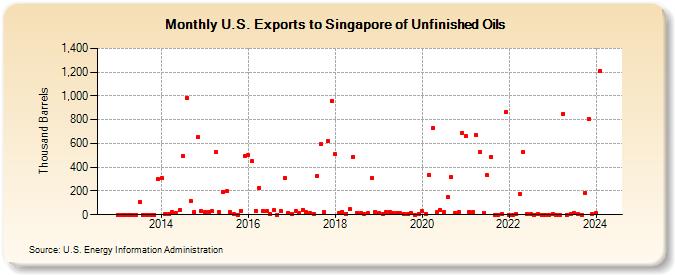
| U.S. Exports to Singapore of Unfinished Oils (Thousand Barrels) | ||||||||
| Year | Jan | Feb | Mar | Apr | May | Jun | Jul | Aug | Sep | Oct | Nov | Dec |
|---|---|---|---|---|---|---|---|---|---|---|---|---|
| 2013 | 1 | 0 | 0 | 0 | 0 | 0 | 108 | 0 | 0 | 0 | 0 | 300 |
| 2014 | 311 | 10 | 8 | 22 | 17 | 39 | 494 | 984 | 116 | 20 | 653 | 28 |
| 2015 | 24 | 26 | 32 | 526 | 23 | 195 | 197 | 22 | 5 | 1 | 34 | 493 |
| 2016 | 499 | 449 | 32 | 229 | 30 | 29 | 6 | 36 | 1 | 30 | 312 | 16 |
| 2017 | 7 | 28 | 14 | 43 | 20 | 12 | 10 | 328 | 595 | 20 | 619 | 961 |
| 2018 | 507 | 13 | 25 | 10 | 45 | 488 | 16 | 16 | 5 | 11 | 311 | 26 |
| 2019 | 15 | 8 | 21 | 25 | 11 | 15 | 12 | 8 | 5 | 17 | 0 | 8 |
| 2020 | 30 | 9 | 338 | 731 | 22 | 41 | 23 | 147 | 317 | 13 | 22 | 688 |
| 2021 | 662 | 27 | 20 | 670 | 527 | 18 | 332 | 489 | 1 | 0 | 7 | 864 |
| 2022 | 0 | 0 | 8 | 176 | 526 | 9 | 8 | 1 | 7 | 1 | 1 | 1 |
| 2023 | 7 | 0 | 1 | 851 | 0 | 9 | 11 | 4 | 1 | 184 | 805 | 5 |
| 2024 | 15 | |||||||||||
| - = No Data Reported; -- = Not Applicable; NA = Not Available; W = Withheld to avoid disclosure of individual company data. |
| Release Date: 3/29/2024 |
| Next Release Date: 4/30/2024 |