|
Download Data (XLS File) |
|
||||||||
|
||||||||
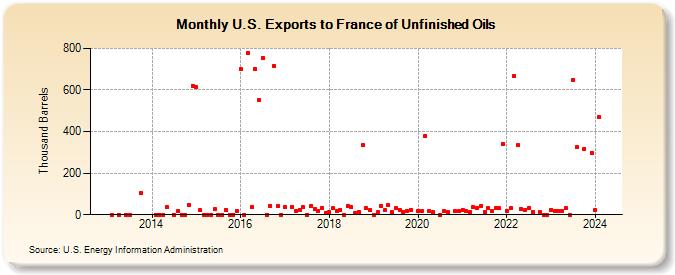
| U.S. Exports to France of Unfinished Oils (Thousand Barrels) | ||||||||
| Year | Jan | Feb | Mar | Apr | May | Jun | Jul | Aug | Sep | Oct | Nov | Dec |
|---|---|---|---|---|---|---|---|---|---|---|---|---|
| 2013 | 0 | 0 | 0 | 0 | 105 | |||||||
| 2014 | 0 | 0 | 1 | 37 | 0 | 16 | 1 | 0 | 48 | 621 | ||
| 2015 | 613 | 21 | 0 | 1 | 1 | 27 | 0 | 0 | 25 | 0 | 1 | 17 |
| 2016 | 700 | 0 | 778 | 35 | 700 | 550 | 754 | 0 | 44 | 717 | 43 | 0 |
| 2017 | 35 | 39 | 19 | 23 | 35 | 1 | 41 | 27 | 19 | 34 | 9 | |
| 2018 | 13 | 31 | 18 | 25 | 1 | 42 | 37 | 10 | 13 | 334 | 31 | 25 |
| 2019 | 0 | 12 | 41 | 21 | 45 | 12 | 32 | 23 | 12 | 16 | 24 | |
| 2020 | 18 | 20 | 379 | 18 | 12 | 0 | 16 | 14 | 19 | 16 | ||
| 2021 | 24 | 16 | 13 | 37 | 33 | 42 | 14 | 30 | 16 | 30 | 31 | 342 |
| 2022 | 20 | 32 | 666 | 336 | 27 | 24 | 31 | 15 | 12 | 0 | 0 | |
| 2023 | 25 | 16 | 17 | 20 | 30 | 0 | 648 | 324 | 318 | 296 | ||
| 2024 | 23 | |||||||||||
| - = No Data Reported; -- = Not Applicable; NA = Not Available; W = Withheld to avoid disclosure of individual company data. |
| Release Date: 3/29/2024 |
| Next Release Date: 4/30/2024 |