|
Download Data (XLS File) |
|
||||||||
|
||||||||
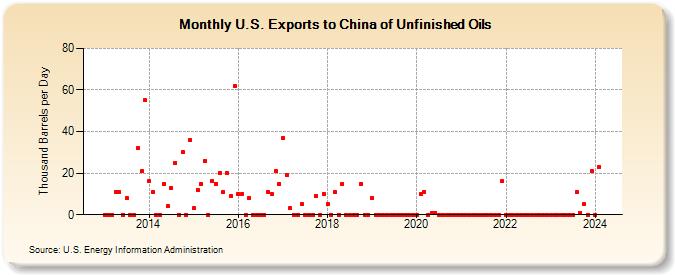
| U.S. Exports to China of Unfinished Oils (Thousand Barrels per Day) | ||||||||
| Year | Jan | Feb | Mar | Apr | May | Jun | Jul | Aug | Sep | Oct | Nov | Dec |
|---|---|---|---|---|---|---|---|---|---|---|---|---|
| 2013 | 0 | 0 | 0 | 11 | 11 | 0 | 8 | 0 | 0 | 32 | 21 | 55 |
| 2014 | 16 | 11 | 0 | 0 | 15 | 4 | 13 | 25 | 0 | 30 | 0 | 36 |
| 2015 | 3 | 12 | 15 | 26 | 0 | 16 | 15 | 20 | 11 | 20 | 9 | 62 |
| 2016 | 10 | 10 | 0 | 8 | 0 | 0 | 0 | 0 | 11 | 10 | 21 | 15 |
| 2017 | 37 | 19 | 3 | 0 | 0 | 5 | 0 | 0 | 0 | 9 | 0 | 10 |
| 2018 | 5 | 0 | 11 | 0 | 15 | 0 | 0 | 0 | 0 | 15 | 0 | 0 |
| 2019 | 8 | 0 | 0 | 0 | 0 | 0 | 0 | 0 | 0 | 0 | 0 | 0 |
| 2020 | 0 | 10 | 11 | 0 | 1 | 1 | 0 | 0 | 0 | 0 | 0 | 0 |
| 2021 | 0 | 0 | 0 | 0 | 0 | 0 | 0 | 0 | 0 | 0 | 0 | 16 |
| 2022 | 0 | 0 | 0 | 0 | 0 | 0 | 0 | 0 | 0 | 0 | 0 | 0 |
| 2023 | 0 | 0 | 0 | 0 | 0 | 0 | 0 | 11 | 1 | 5 | 0 | 21 |
| 2024 | 0 | |||||||||||
| - = No Data Reported; -- = Not Applicable; NA = Not Available; W = Withheld to avoid disclosure of individual company data. |
| Release Date: 3/29/2024 |
| Next Release Date: 4/30/2024 |