|
Download Data (XLS File) |
|
||||||||
|
||||||||
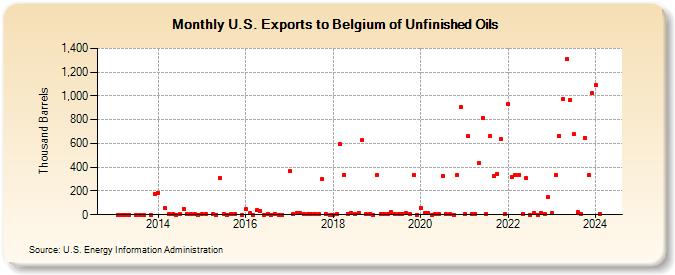
| U.S. Exports to Belgium of Unfinished Oils (Thousand Barrels) | ||||||||
| Year | Jan | Feb | Mar | Apr | May | Jun | Jul | Aug | Sep | Oct | Nov | Dec |
|---|---|---|---|---|---|---|---|---|---|---|---|---|
| 2013 | 0 | 0 | 0 | 0 | 0 | 0 | 0 | 0 | 177 | |||
| 2014 | 183 | 53 | 3 | 5 | 1 | 5 | 51 | 3 | 4 | 3 | 0 | |
| 2015 | 3 | 3 | 3 | 1 | 311 | 4 | 0 | 7 | 5 | 0 | ||
| 2016 | 47 | 11 | 1 | 37 | 32 | 0 | 5 | 0 | 2 | 0 | 0 | |
| 2017 | 366 | 3 | 14 | 11 | 2 | 3 | 5 | 9 | 2 | 302 | 4 | 0 |
| 2018 | 1 | 5 | 593 | 335 | 6 | 16 | 3 | 16 | 626 | 3 | 9 | 0 |
| 2019 | 334 | 4 | 7 | 5 | 20 | 10 | 2 | 8 | 14 | 3 | 337 | 1 |
| 2020 | 55 | 13 | 12 | 0 | 6 | 5 | 325 | 3 | 2 | 1 | 331 | 906 |
| 2021 | 2 | 660 | 4 | 10 | 434 | 817 | 6 | 663 | 328 | 342 | 635 | 3 |
| 2022 | 933 | 319 | 334 | 338 | 8 | 305 | 0 | 15 | 0 | 14 | 2 | 145 |
| 2023 | 11 | 335 | 666 | 973 | 1,309 | 963 | 677 | 19 | 7 | 649 | 332 | 1,022 |
| 2024 | 1,089 | |||||||||||
| - = No Data Reported; -- = Not Applicable; NA = Not Available; W = Withheld to avoid disclosure of individual company data. |
| Release Date: 3/29/2024 |
| Next Release Date: 4/30/2024 |