|
Download Data (XLS File) |
|
||||||||
|
||||||||
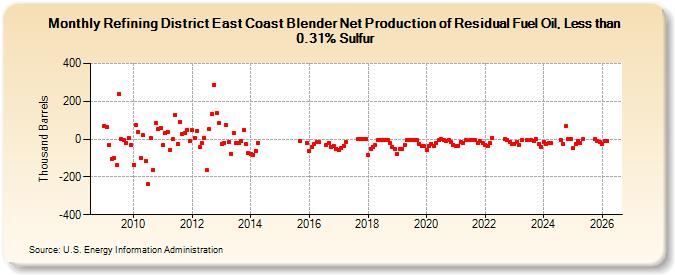
| Refining District East Coast Blender Net Production of Residual Fuel Oil, Less than 0.31% Sulfur (Thousand Barrels) | ||||||||
| Year | Jan | Feb | Mar | Apr | May | Jun | Jul | Aug | Sep | Oct | Nov | Dec |
|---|---|---|---|---|---|---|---|---|---|---|---|---|
| 2009 | 71 | 63 | -32 | -105 | -99 | -139 | 240 | -2 | -6 | -21 | 7 | -32 |
| 2010 | -135 | 72 | 35 | -102 | 20 | -116 | -239 | 5 | -164 | 87 | 53 | 61 |
| 2011 | -32 | 32 | 39 | -57 | -2 | 129 | -25 | 90 | 26 | 33 | 48 | -12 |
| 2012 | 46 | 7 | 45 | -44 | -21 | 7 | -166 | 55 | 134 | 285 | 140 | 85 |
| 2013 | -24 | -18 | 74 | -13 | -78 | 32 | -20 | -19 | -9 | 49 | -26 | -74 |
| 2014 | -77 | -83 | -63 | -19 | ||||||||
| 2015 | -10 | -20 | ||||||||||
| 2016 | -65 | -43 | -26 | -16 | -16 | -32 | -20 | -42 | -39 | -51 | ||
| 2017 | -59 | -46 | -34 | -15 | 1 | 1 | 1 | 1 | ||||
| 2018 | -84 | -50 | -40 | -30 | -6 | -4 | -7 | -7 | -7 | -21 | -42 | -51 |
| 2019 | -78 | -54 | -50 | -29 | -6 | -7 | -7 | -7 | -7 | -25 | -37 | -37 |
| 2020 | -60 | -36 | -24 | -35 | -18 | -6 | -1 | -4 | -9 | -6 | -17 | -30 |
| 2021 | -39 | -35 | -13 | -19 | -6 | -4 | -4 | -7 | -20 | -12 | -22 | |
| 2022 | -30 | -34 | -22 | 8 | 0 | -7 | -14 | -25 | ||||
| 2023 | -28 | -16 | -30 | -7 | -5 | -5 | -8 | 0 | -28 | -44 | ||
| 2024 | -13 | |||||||||||
| - = No Data Reported; -- = Not Applicable; NA = Not Available; W = Withheld to avoid disclosure of individual company data. |
| Release Date: 3/29/2024 |
| Next Release Date: 4/30/2024 |