|
Download Data (XLS File) |
|
||||||||
|
||||||||
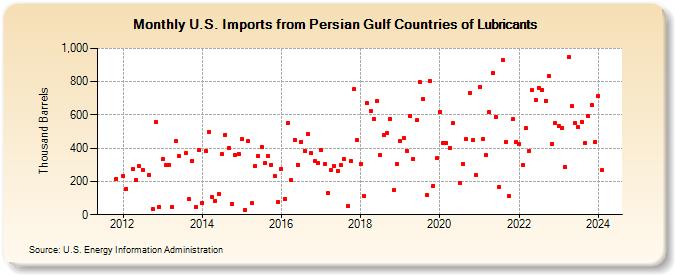
| U.S. Imports from Persian Gulf Countries of Lubricants (Thousand Barrels) | ||||||||
| Year | Jan | Feb | Mar | Apr | May | Jun | Jul | Aug | Sep | Oct | Nov | Dec |
|---|---|---|---|---|---|---|---|---|---|---|---|---|
| 2011 | 215 | |||||||||||
| 2012 | 233 | 155 | 273 | 209 | 291 | 271 | 239 | 33 | 558 | 49 | ||
| 2013 | 333 | 297 | 300 | 45 | 444 | 354 | 369 | 92 | 325 | 45 | 389 | |
| 2014 | 73 | 383 | 499 | 108 | 84 | 127 | 366 | 481 | 404 | 67 | 360 | 366 |
| 2015 | 455 | 30 | 443 | 68 | 291 | 353 | 410 | 308 | 351 | 300 | 233 | 77 |
| 2016 | 276 | 95 | 552 | 207 | 452 | 301 | 438 | 386 | 484 | 369 | 320 | 312 |
| 2017 | 391 | 305 | 128 | 266 | 294 | 265 | 300 | 332 | 51 | 321 | 753 | 449 |
| 2018 | 302 | 114 | 669 | 625 | 576 | 681 | 360 | 478 | 489 | 576 | 150 | 304 |
| 2019 | 441 | 460 | 385 | 595 | 337 | 567 | 795 | 695 | 119 | 803 | 173 | 339 |
| 2020 | 619 | 433 | 432 | 404 | 549 | 193 | 306 | 455 | 734 | 449 | 238 | |
| 2021 | 767 | 458 | 358 | 615 | 850 | 588 | 169 | 928 | 440 | 112 | 573 | 438 |
| 2022 | 425 | 298 | 519 | 382 | 747 | 689 | 764 | 752 | 686 | 835 | 427 | 549 |
| 2023 | 531 | 523 | 286 | 947 | 652 | 549 | 527 | 560 | 434 | 592 | 658 | 435 |
| 2024 | 715 | 266 | 775 | 995 | 354 | 953 | ||||||
| - = No Data Reported; -- = Not Applicable; NA = Not Available; W = Withheld to avoid disclosure of individual company data. |
| Release Date: 8/30/2024 |
| Next Release Date: 9/30/2024 |