|
Download Data (XLS File) |
|
||||||||
|
||||||||
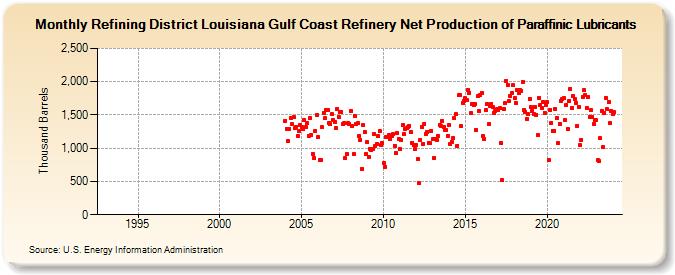
| Refining District Louisiana Gulf Coast Refinery Net Production of Paraffinic Lubricants (Thousand Barrels) | ||||||||
| Year | Jan | Feb | Mar | Apr | May | Jun | Jul | Aug | Sep | Oct | Nov | Dec |
|---|---|---|---|---|---|---|---|---|---|---|---|---|
| 1993 | W | W | W | W | W | W | W | W | W | W | W | W |
| 1994 | W | W | W | W | W | W | W | W | W | W | W | W |
| 1995 | W | W | W | W | W | W | W | W | W | W | W | W |
| 1996 | W | W | W | W | W | W | W | W | W | W | W | W |
| 1997 | W | W | W | W | W | W | W | W | W | W | W | W |
| 1998 | W | W | W | W | W | W | W | W | W | W | W | W |
| 1999 | W | W | W | W | W | W | W | W | W | W | W | W |
| 2000 | W | W | W | W | W | W | W | W | W | W | W | W |
| 2001 | W | W | W | W | W | W | W | W | W | W | W | W |
| 2002 | W | W | W | W | W | W | W | W | W | W | W | W |
| 2003 | W | W | W | W | W | W | W | W | W | W | W | W |
| 2004 | 1,413 | 1,295 | 1,109 | 1,295 | 1,456 | 1,358 | 1,466 | 1,299 | 1,322 | 1,185 | 1,264 | 1,347 |
| 2005 | 1,316 | 1,286 | 1,421 | 1,312 | 1,380 | 1,188 | 1,450 | 1,197 | 916 | 850 | 1,262 | 1,499 |
| 2006 | 1,166 | 825 | 826 | 1,315 | 1,536 | 1,447 | 1,576 | 1,572 | 1,379 | 1,358 | 1,511 | 1,424 |
| 2007 | 1,397 | 1,297 | 1,590 | 1,469 | 1,539 | 1,546 | 1,366 | 1,373 | 851 | 908 | 1,375 | 1,362 |
| 2008 | 1,566 | 1,328 | 909 | 1,488 | 1,368 | 1,374 | 1,187 | 1,129 | 691 | 1,344 | 1,245 | 914 |
| 2009 | 1,087 | 866 | 993 | 980 | 992 | 1,211 | 1,040 | 1,066 | 1,177 | 1,253 | 1,042 | 1,076 |
| 2010 | 774 | 721 | 1,161 | 1,161 | 1,196 | 1,145 | 1,184 | 1,209 | 1,039 | 932 | 1,222 | 1,139 |
| 2011 | 984 | 1,126 | 1,351 | 1,211 | 1,285 | 1,307 | 1,320 | 1,338 | 1,247 | 1,085 | 1,042 | 995 |
| 2012 | 1,048 | 830 | 470 | 1,124 | 1,317 | 1,068 | 1,368 | 1,218 | 1,248 | 1,083 | 1,072 | 1,259 |
| 2013 | 1,135 | 854 | 1,136 | 1,129 | 1,181 | 1,352 | 1,335 | 1,413 | 1,313 | 1,266 | 1,270 | 1,184 |
| 2014 | 1,342 | 1,061 | 1,097 | 1,153 | 1,450 | 1,508 | 1,037 | 1,796 | 1,795 | 1,328 | 1,681 | 1,708 |
| 2015 | 1,747 | 1,723 | 1,875 | 1,835 | 1,523 | 1,671 | 1,654 | 1,665 | 1,279 | 1,778 | 1,552 | 1,798 |
| 2016 | 1,832 | 1,179 | 1,138 | 1,578 | 1,658 | 1,357 | 1,635 | 1,670 | 1,614 | 1,535 | 1,565 | 1,584 |
| 2017 | 1,577 | 1,599 | 1,076 | 519 | 1,584 | 1,676 | 2,017 | 1,950 | 1,707 | 1,782 | 1,836 | 1,944 |
| 2018 | 1,755 | 1,680 | 1,875 | 1,829 | 1,872 | 1,865 | 2,002 | 1,571 | 1,548 | 1,446 | 1,507 | 1,744 |
| 2019 | 1,616 | 1,560 | 1,518 | 1,620 | 1,506 | 1,198 | 1,761 | 1,645 | 1,611 | 1,690 | 1,535 | 1,645 |
| 2020 | 1,701 | 822 | 1,577 | 1,382 | 1,259 | 1,257 | 1,590 | 1,447 | 1,077 | 1,370 | 1,716 | 1,735 |
| 2021 | 1,752 | 1,428 | 1,656 | 1,281 | 1,709 | 1,897 | 1,611 | 1,788 | 1,734 | 1,683 | 1,332 | 1,622 |
| 2022 | 1,043 | 1,129 | 1,775 | 1,870 | 1,793 | 1,609 | 1,774 | 1,475 | 1,569 | 1,468 | 1,368 | 1,418 |
| 2023 | 1,417 | 816 | 804 | 1,146 | 1,565 | 1,015 | 1,535 | 1,757 | 1,583 | 1,691 | 1,378 | 1,565 |
| 2024 | 1,518 | 1,539 | 1,589 | 1,501 | 1,566 | 1,268 | ||||||
| - = No Data Reported; -- = Not Applicable; NA = Not Available; W = Withheld to avoid disclosure of individual company data. |
| Release Date: 8/30/2024 |
| Next Release Date: 9/30/2024 |