|
Download Data (XLS File) |
|
||||||||
|
||||||||
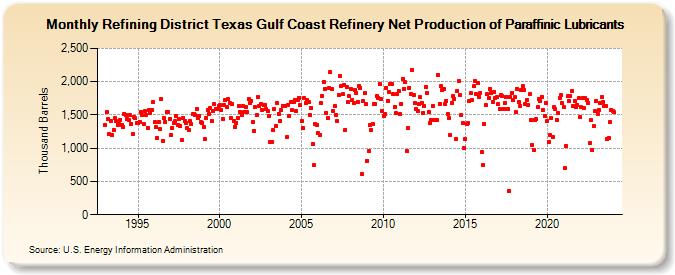
| Refining District Texas Gulf Coast Refinery Net Production of Paraffinic Lubricants (Thousand Barrels) | ||||||||
| Year | Jan | Feb | Mar | Apr | May | Jun | Jul | Aug | Sep | Oct | Nov | Dec |
|---|---|---|---|---|---|---|---|---|---|---|---|---|
| 1993 | 1,343 | 1,540 | 1,444 | 1,213 | 1,415 | 1,201 | 1,274 | 1,447 | 1,403 | 1,354 | 1,365 | 1,431 |
| 1994 | 1,341 | 1,324 | 1,512 | 1,506 | 1,438 | 1,427 | 1,500 | 1,370 | 1,208 | 1,466 | 1,449 | 1,385 |
| 1995 | 1,383 | 1,391 | 1,544 | 1,495 | 1,367 | 1,552 | 1,496 | 1,308 | 1,573 | 1,536 | 1,573 | 1,691 |
| 1996 | 1,390 | 1,311 | 1,160 | 1,390 | 1,291 | 1,733 | 1,114 | 1,451 | 1,401 | 1,538 | 1,537 | 1,434 |
| 1997 | 1,200 | 1,296 | 1,386 | 1,404 | 1,480 | 1,355 | 1,437 | 1,333 | 1,121 | 1,460 | 1,410 | 1,384 |
| 1998 | 1,301 | 1,266 | 1,408 | 1,364 | 1,509 | 1,518 | 1,492 | 1,593 | 1,452 | 1,491 | 1,388 | 1,385 |
| 1999 | 1,320 | 1,133 | 1,459 | 1,573 | 1,517 | 1,597 | 1,416 | 1,552 | 1,658 | 1,594 | 1,585 | 1,641 |
| 2000 | 1,646 | 1,568 | 1,438 | 1,650 | 1,717 | 1,621 | 1,732 | 1,684 | 1,454 | 1,659 | 1,408 | 1,318 |
| 2001 | 1,386 | 1,461 | 1,635 | 1,544 | 1,497 | 1,633 | 1,548 | 1,617 | 1,538 | 1,732 | 1,682 | 1,715 |
| 2002 | 1,397 | 1,263 | 1,612 | 1,496 | 1,769 | 1,630 | 1,664 | 1,578 | 1,642 | 1,652 | 1,582 | 1,554 |
| 2003 | 1,481 | 1,086 | 1,100 | 1,269 | 1,590 | 1,334 | 1,674 | 1,518 | 1,412 | 1,570 | 1,640 | 1,631 |
| 2004 | 1,627 | 1,163 | 1,648 | 1,486 | 1,695 | 1,573 | 1,687 | 1,728 | 1,561 | 1,724 | 1,760 | 1,645 |
| 2005 | 1,411 | 1,301 | 1,758 | 1,677 | 1,721 | 1,700 | 1,496 | 1,602 | 1,067 | 741 | 1,360 | 1,352 |
| 2006 | 1,222 | 1,192 | 1,684 | 1,790 | 1,995 | 1,895 | 1,533 | 1,453 | 1,911 | 2,139 | 1,888 | 1,560 |
| 2007 | 1,632 | 1,501 | 1,409 | 1,796 | 2,081 | 1,942 | 1,812 | 1,956 | 1,277 | 1,915 | 1,690 | 1,780 |
| 2008 | 1,892 | 1,728 | 1,682 | 1,881 | 1,833 | 1,695 | 1,928 | 1,908 | 610 | 1,710 | 1,825 | 1,663 |
| 2009 | 812 | 954 | 1,345 | 1,277 | 1,371 | 1,665 | 1,663 | 1,779 | 1,761 | 1,966 | 1,734 | 1,558 |
| 2010 | 1,479 | 1,513 | 1,908 | 1,713 | 1,843 | 1,958 | 1,968 | 1,807 | 1,613 | 1,527 | 1,812 | 1,862 |
| 2011 | 1,511 | 1,671 | 2,046 | 1,896 | 1,990 | 952 | 1,302 | 1,911 | 1,813 | 2,180 | 1,795 | 1,675 |
| 2012 | 1,587 | 1,556 | 1,661 | 1,768 | 1,686 | 1,536 | 1,630 | 1,921 | 1,824 | 1,546 | 1,375 | 1,431 |
| 2013 | 1,639 | 1,420 | 1,419 | 1,425 | 2,105 | 1,669 | 1,929 | 1,877 | 1,892 | 1,659 | 1,713 | 1,517 |
| 2014 | 1,450 | 1,200 | 1,679 | 1,778 | 1,742 | 1,132 | 1,863 | 2,006 | 1,795 | 1,494 | 1,373 | 1,003 |
| 2015 | 1,142 | 1,365 | 1,373 | 1,709 | 1,828 | 1,720 | 1,928 | 2,009 | 1,807 | 1,980 | 1,774 | 1,835 |
| 2016 | 939 | 746 | 1,359 | 1,645 | 1,809 | 1,751 | 1,893 | 1,826 | 1,699 | 1,852 | 1,754 | 1,773 |
| 2017 | 1,662 | 1,596 | 1,792 | 1,777 | 1,595 | 1,682 | 1,776 | 1,595 | 353 | 1,765 | 1,832 | 1,723 |
| 2018 | 1,763 | 1,547 | 1,892 | 1,691 | 1,637 | 1,870 | 1,932 | 1,873 | 1,669 | 1,721 | 1,653 | 1,807 |
| 2019 | 1,421 | 1,054 | 980 | 1,430 | 1,438 | 1,623 | 1,745 | 1,706 | 1,775 | 1,570 | 1,484 | 1,683 |
| 2020 | 1,413 | 1,095 | 1,192 | 1,455 | 1,168 | 1,618 | 1,582 | 1,420 | 1,531 | 1,757 | 1,794 | 1,673 |
| 2021 | 1,612 | 701 | 1,028 | 1,778 | 1,713 | 1,785 | 1,860 | 1,639 | 1,707 | 1,618 | 1,650 | 1,748 |
| 2022 | 1,466 | 1,615 | 1,753 | 1,597 | 1,751 | 1,727 | 1,681 | 1,077 | 1,421 | 976 | 1,326 | 1,553 |
| 2023 | 1,708 | 1,515 | 1,575 | 1,675 | 1,766 | 1,696 | 1,628 | 1,640 | 1,138 | 1,157 | 1,388 | 1,572 |
| 2024 | 1,564 | |||||||||||
| - = No Data Reported; -- = Not Applicable; NA = Not Available; W = Withheld to avoid disclosure of individual company data. |
| Release Date: 3/29/2024 |
| Next Release Date: 4/30/2024 |