|
Download Data (XLS File) |
|
||||||||
|
||||||||
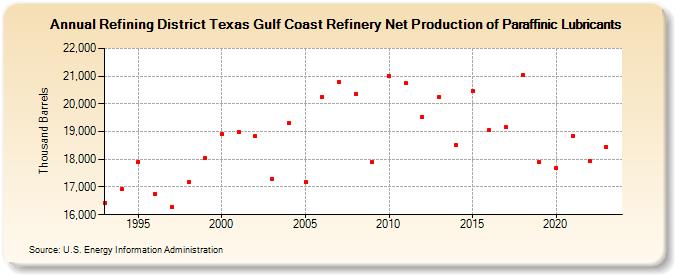
| Refining District Texas Gulf Coast Refinery Net Production of Paraffinic Lubricants (Thousand Barrels) | ||||||||
| Decade | Year-0 | Year-1 | Year-2 | Year-3 | Year-4 | Year-5 | Year-6 | Year-7 | Year-8 | Year-9 |
|---|---|---|---|---|---|---|---|---|---|---|
| 1990's | 16,430 | 16,926 | 17,909 | 16,750 | 16,266 | 17,167 | 18,045 | |||
| 2000's | 18,895 | 18,988 | 18,839 | 17,305 | 19,297 | 17,186 | 20,262 | 20,791 | 20,355 | 17,885 |
| 2010's | 21,003 | 20,742 | 19,521 | 20,264 | 18,515 | 20,470 | 19,046 | 19,148 | 21,055 | 17,909 |
| 2020's | 17,698 | 18,839 | 17,943 | 18,458 |
| - = No Data Reported; -- = Not Applicable; NA = Not Available; W = Withheld to avoid disclosure of individual company data. |
| Release Date: 3/29/2024 |
| Next Release Date: 8/30/2024 |