|
Download Data (XLS File) |
|
||||||||
|
||||||||
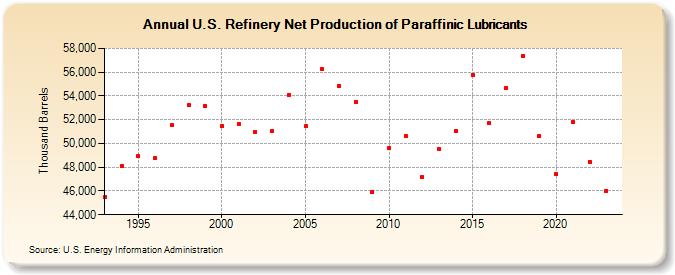
| U.S. Refinery Net Production of Paraffinic Lubricants (Thousand Barrels) | ||||||||
| Decade | Year-0 | Year-1 | Year-2 | Year-3 | Year-4 | Year-5 | Year-6 | Year-7 | Year-8 | Year-9 |
|---|---|---|---|---|---|---|---|---|---|---|
| 1990's | 45,455 | 48,130 | 48,962 | 48,741 | 51,515 | 53,224 | 53,156 | |||
| 2000's | 51,488 | 51,649 | 50,996 | 51,013 | 54,093 | 51,436 | 56,253 | 54,815 | 53,504 | 45,876 |
| 2010's | 49,627 | 50,626 | 47,176 | 49,515 | 51,015 | 55,802 | 51,683 | 54,696 | 57,338 | 50,639 |
| 2020's | 47,433 | 51,797 | 48,470 | 46,003 |
| - = No Data Reported; -- = Not Applicable; NA = Not Available; W = Withheld to avoid disclosure of individual company data. |
| Release Date: 3/29/2024 |
| Next Release Date: 8/30/2024 |