|
Download Data (XLS File) |
|
||||||||
|
||||||||
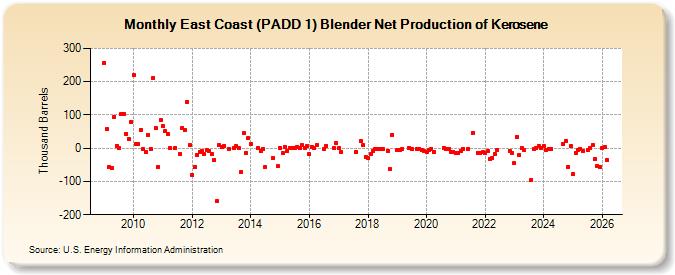
| East Coast (PADD 1) Blender Net Production of Kerosene (Thousand Barrels) | ||||||||
| Year | Jan | Feb | Mar | Apr | May | Jun | Jul | Aug | Sep | Oct | Nov | Dec |
|---|---|---|---|---|---|---|---|---|---|---|---|---|
| 2009 | 257 | 58 | -56 | -61 | 95 | 8 | 0 | 104 | 104 | 44 | 28 | 80 |
| 2010 | 220 | 14 | 12 | 56 | -3 | -12 | 41 | -3 | 212 | 61 | -56 | 85 |
| 2011 | 67 | 51 | 42 | 0 | 1 | -17 | 61 | 54 | 140 | 9 | ||
| 2012 | -80 | -57 | -19 | -11 | -7 | -18 | -6 | -8 | -18 | -35 | -159 | 9 |
| 2013 | 4 | 7 | -1 | 1 | 7 | 0 | -73 | 45 | -14 | 30 | ||
| 2014 | 13 | 0 | -8 | -2 | -57 | -29 | -55 | |||||
| 2015 | 0 | -14 | 4 | -7 | 2 | 2 | 0 | 4 | 1 | 9 | 1 | 6 |
| 2016 | -18 | 5 | 1 | 10 | -2 | 8 | 2 | 15 | ||||
| 2017 | 0 | -12 | -11 | 21 | 11 | -27 | ||||||
| 2018 | -31 | -18 | -9 | -2 | -1 | -2 | -2 | -7 | -62 | 41 | ||
| 2019 | -6 | -6 | -3 | 2 | -2 | -1 | -1 | -6 | -7 | |||
| 2020 | -10 | -5 | -1 | -11 | 1 | -1 | -1 | -12 | -11 | |||
| 2021 | -15 | -14 | -8 | -1 | -1 | 47 | -13 | -15 | -12 | |||
| 2022 | -13 | -9 | -32 | -29 | -18 | -5 | -8 | -13 | ||||
| 2023 | -46 | 19 | -21 | 1 | -4 | -95 | -3 | 1 | 7 | 1 | ||
| 2024 | 8 | |||||||||||
| - = No Data Reported; -- = Not Applicable; NA = Not Available; W = Withheld to avoid disclosure of individual company data. |
| Release Date: 3/29/2024 |
| Next Release Date: 4/30/2024 |
Referring Pages: