|
Download Data (XLS File) |
|
||||||||
|
||||||||
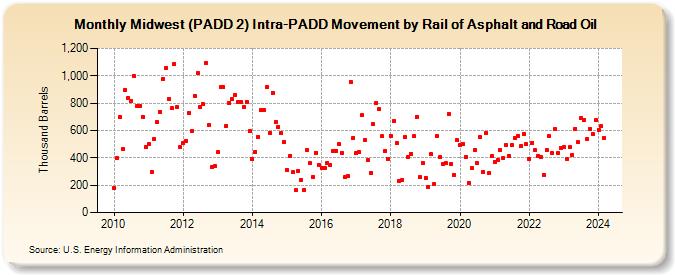
| Midwest (PADD 2) Intra-PADD Movement by Rail of Asphalt and Road Oil (Thousand Barrels) | ||||||||
| Year | Jan | Feb | Mar | Apr | May | Jun | Jul | Aug | Sep | Oct | Nov | Dec |
|---|---|---|---|---|---|---|---|---|---|---|---|---|
| 2010 | 179 | 398 | 697 | 463 | 898 | 838 | 818 | 998 | 779 | 780 | 700 | 480 |
| 2011 | 499 | 299 | 539 | 660 | 738 | 978 | 1,060 | 833 | 761 | 1,086 | 773 | 480 |
| 2012 | 505 | 525 | 728 | 594 | 852 | 1,020 | 771 | 791 | 1,093 | 640 | 335 | 337 |
| 2013 | 440 | 917 | 917 | 634 | 799 | 827 | 862 | 806 | 808 | 774 | 811 | 594 |
| 2014 | 388 | 445 | 555 | 747 | 751 | 915 | 584 | 876 | 660 | 628 | 580 | 518 |
| 2015 | 314 | 414 | 294 | 163 | 307 | 238 | 168 | 455 | 359 | 260 | 439 | 346 |
| 2016 | 325 | 325 | 362 | 346 | 450 | 452 | 500 | 436 | 258 | 266 | 955 | 548 |
| 2017 | 435 | 441 | 710 | 529 | 384 | 291 | 645 | 800 | 755 | 557 | 451 | 394 |
| 2018 | 561 | 669 | 506 | 231 | 241 | 550 | 407 | 431 | 558 | 702 | 260 | 363 |
| 2019 | 256 | 185 | 426 | 208 | 560 | 404 | 356 | 362 | 721 | 358 | 275 | 528 |
| 2020 | 495 | 503 | 408 | 219 | 325 | 457 | 361 | 552 | 298 | 582 | 288 | 411 |
| 2021 | 372 | 385 | 459 | 397 | 492 | 414 | 493 | 545 | 563 | 483 | 573 | 501 |
| 2022 | 388 | 511 | 457 | 414 | 406 | 278 | 458 | 556 | 433 | 610 | 435 | 474 |
| 2023 | 482 | 395 | 477 | 421 | 614 | 513 | 693 | 678 | 540 | 614 | 563 | 673 |
| 2024 | 576 | 558 | ||||||||||
| - = No Data Reported; -- = Not Applicable; NA = Not Available; W = Withheld to avoid disclosure of individual company data. |
| Release Date: 4/30/2024 |
| Next Release Date: 5/31/2024 |