|
Download Data (XLS File) |
|
||||||||
|
||||||||
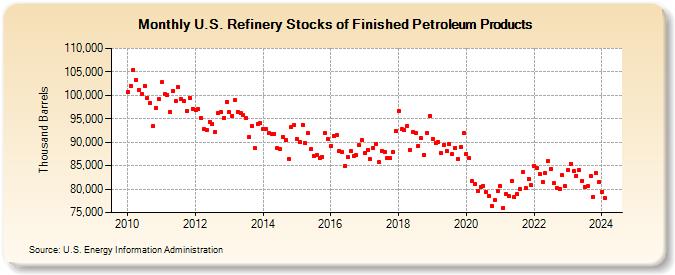
| U.S. Refinery Stocks of Finished Petroleum Products (Thousand Barrels) | ||||||||
| Year | Jan | Feb | Mar | Apr | May | Jun | Jul | Aug | Sep | Oct | Nov | Dec |
|---|---|---|---|---|---|---|---|---|---|---|---|---|
| 2010 | 100,726 | 101,984 | 105,463 | 103,341 | 101,173 | 100,299 | 101,998 | 99,425 | 98,419 | 93,429 | 97,322 | 99,293 |
| 2011 | 102,762 | 100,258 | 100,041 | 96,504 | 100,985 | 98,761 | 101,726 | 99,226 | 98,821 | 96,622 | 99,431 | 97,120 |
| 2012 | 96,957 | 97,012 | 95,223 | 92,827 | 92,671 | 94,395 | 93,903 | 92,266 | 96,150 | 96,443 | 95,188 | 98,635 |
| 2013 | 96,394 | 95,691 | 98,920 | 96,534 | 96,133 | 95,748 | 95,106 | 91,152 | 93,435 | 88,691 | 93,912 | 94,115 |
| 2014 | 92,755 | 92,743 | 91,929 | 91,832 | 91,780 | 88,791 | 88,607 | 91,166 | 90,430 | 86,440 | 93,222 | 93,711 |
| 2015 | 90,750 | 89,984 | 93,754 | 89,731 | 91,866 | 88,550 | 87,146 | 87,235 | 86,563 | 86,935 | 91,937 | 90,612 |
| 2016 | 89,273 | 91,405 | 91,579 | 88,209 | 87,944 | 84,955 | 86,846 | 88,118 | 87,084 | 87,323 | 89,405 | 90,467 |
| 2017 | 87,742 | 88,411 | 86,362 | 88,786 | 89,677 | 85,674 | 88,190 | 87,964 | 86,692 | 86,576 | 87,909 | 92,433 |
| 2018 | 96,697 | 92,766 | 92,589 | 93,473 | 88,422 | 92,273 | 91,891 | 89,272 | 90,856 | 87,239 | 92,019 | 95,682 |
| 2019 | 90,692 | 89,780 | 90,059 | 87,690 | 89,492 | 88,164 | 89,695 | 87,414 | 88,826 | 86,446 | 89,023 | 91,888 |
| 2020 | 87,510 | 86,634 | 81,672 | 81,040 | 79,498 | 80,522 | 80,712 | 79,399 | 78,627 | 76,471 | 77,729 | 79,673 |
| 2021 | 80,620 | 76,039 | 78,934 | 78,456 | 81,737 | 78,226 | 78,969 | 79,966 | 83,559 | 80,166 | 82,169 | 80,802 |
| 2022 | 84,975 | 84,409 | 83,176 | 81,583 | 83,450 | 85,957 | 84,338 | 81,246 | 80,201 | 80,096 | 82,993 | 80,605 |
| 2023 | 84,035 | 85,459 | 83,837 | 82,895 | 83,988 | 81,771 | 80,486 | 80,600 | 82,761 | 78,329 | 83,377 | 81,543 |
| 2024 | 79,459 | |||||||||||
| - = No Data Reported; -- = Not Applicable; NA = Not Available; W = Withheld to avoid disclosure of individual company data. |
| Release Date: 3/29/2024 |
| Next Release Date: 4/30/2024 |