|
Download Data (XLS File) |
|
||||||||
|
||||||||
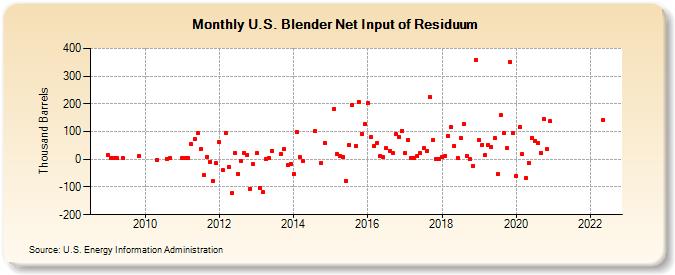
| U.S. Blender Net Input of Residuum (Thousand Barrels) | ||||||||
| Year | Jan | Feb | Mar | Apr | May | Jun | Jul | Aug | Sep | Oct | Nov | Dec |
|---|---|---|---|---|---|---|---|---|---|---|---|---|
| 2009 | 15 | 5 | 4 | 3 | 3 | 13 | ||||||
| 2010 | -1 | 1 | 3 | |||||||||
| 2011 | 4 | 6 | 4 | 55 | 74 | 94 | 37 | -58 | 10 | -9 | -79 | -15 |
| 2012 | 61 | -39 | 95 | -28 | -123 | 23 | -52 | -6 | 24 | 17 | -106 | -18 |
| 2013 | 22 | -102 | -119 | 0 | 5 | 31 | 19 | 37 | -21 | -16 | ||
| 2014 | -54 | 99 | 7 | -5 | 101 | -13 | 60 | |||||
| 2015 | 182 | 19 | 12 | 7 | -77 | 52 | 197 | 48 | 206 | 92 | 127 | |
| 2016 | 202 | 79 | 48 | 60 | 12 | 7 | 39 | 31 | 22 | 92 | 81 | 103 |
| 2017 | 22 | 70 | 4 | 5 | 11 | 21 | 39 | 29 | 226 | 69 | 2 | 2 |
| 2018 | 8 | 12 | 85 | 115 | 48 | 6 | 76 | 127 | 12 | 0 | -24 | 359 |
| 2019 | 69 | 53 | 15 | 50 | 45 | 76 | -53 | 159 | 93 | 39 | 351 | 93 |
| 2020 | -60 | 116 | 19 | -66 | -12 | 78 | 66 | 59 | 24 | 144 | 36 | 137 |
| 2022 | 143 | |||||||||||
| - = No Data Reported; -- = Not Applicable; NA = Not Available; W = Withheld to avoid disclosure of individual company data. |
| Release Date: 4/30/2024 |
| Next Release Date: 5/31/2024 |