|
Download Data (XLS File) |
|
||||||||
|
||||||||
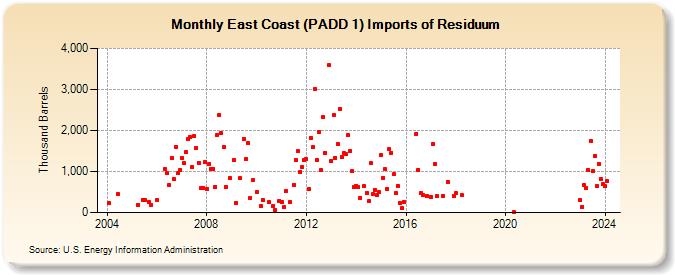
| East Coast (PADD 1) Imports of Residuum (Thousand Barrels) | ||||||||
| Year | Jan | Feb | Mar | Apr | May | Jun | Jul | Aug | Sep | Oct | Nov | Dec |
|---|---|---|---|---|---|---|---|---|---|---|---|---|
| 2004 | 222 | 455 | ||||||||||
| 2005 | 189 | 309 | 313 | 258 | 187 | |||||||
| 2006 | 310 | 1,050 | 956 | 673 | 1,333 | 818 | 1,608 | 954 | 1,032 | |||
| 2007 | 1,330 | 1,201 | 1,478 | 1,794 | 1,840 | 1,117 | 1,865 | 1,580 | 1,219 | 591 | 589 | 1,222 |
| 2008 | 578 | 1,183 | 1,063 | 1,056 | 634 | 1,892 | 2,381 | 1,932 | 1,586 | 631 | 840 | |
| 2009 | 1,289 | 241 | 837 | 1,788 | 1,304 | 1,687 | 365 | 782 | ||||
| 2010 | 503 | 162 | 301 | 250 | 166 | 63 | 293 | |||||
| 2011 | 253 | 125 | 525 | 253 | 682 | 1,279 | 1,489 | 988 | 1,098 | 1,281 | ||
| 2012 | 1,293 | 577 | 1,826 | 1,591 | 3,003 | 1,286 | 1,969 | 1,027 | 2,324 | 1,458 | 3,584 | |
| 2013 | 1,257 | 2,383 | 1,334 | 1,676 | 2,529 | 1,352 | 1,441 | 1,417 | 1,883 | 1,500 | 1,006 | 612 |
| 2014 | 651 | 611 | 365 | 647 | 482 | 275 | 1,198 | 445 | 551 | 423 | 494 | |
| 2015 | 1,403 | 854 | 1,052 | 584 | 1,540 | 1,463 | 931 | 470 | 655 | 230 | 100 | 268 |
| 2016 | 1,923 | 1,047 | 480 | 417 | 392 | |||||||
| 2017 | 384 | 1,671 | 1,195 | 400 | 415 | 751 | 413 | |||||
| 2018 | 467 | 418 | ||||||||||
| 2020 | 3 | |||||||||||
| 2023 | 300 | 139 | 667 | 598 | 1,034 | 1,739 | 1,003 | 1,373 | 638 | 1,184 | 818 | 687 |
| 2024 | 641 | |||||||||||
| - = No Data Reported; -- = Not Applicable; NA = Not Available; W = Withheld to avoid disclosure of individual company data. |
| Release Date: 3/29/2024 |
| Next Release Date: 4/30/2024 |