|
Download Data (XLS File) |
|
||||||||
|
||||||||
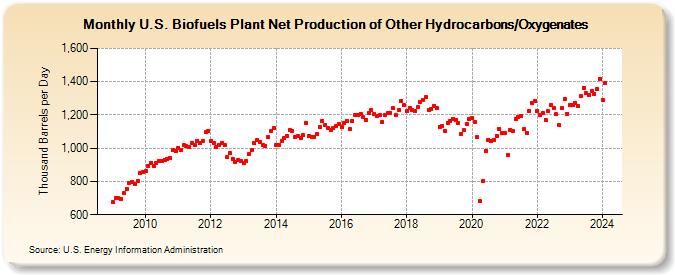
| U.S. Biofuels Plant Net Production of Other Hydrocarbons/Oxygenates (Thousand Barrels per Day) | ||||||||
| Year | Jan | Feb | Mar | Apr | May | Jun | Jul | Aug | Sep | Oct | Nov | Dec |
|---|---|---|---|---|---|---|---|---|---|---|---|---|
| 2009 | 676 | 700 | 698 | 695 | 729 | 756 | 789 | 799 | 787 | 802 | 850 | 856 |
| 2010 | 864 | 891 | 913 | 895 | 910 | 923 | 924 | 929 | 932 | 943 | 987 | 981 |
| 2011 | 1,001 | 991 | 1,019 | 1,013 | 1,010 | 1,033 | 1,021 | 1,046 | 1,029 | 1,041 | 1,095 | 1,105 |
| 2012 | 1,041 | 1,032 | 1,008 | 1,019 | 1,033 | 1,020 | 944 | 971 | 937 | 918 | 931 | 921 |
| 2013 | 908 | 922 | 966 | 988 | 1,029 | 1,051 | 1,038 | 1,020 | 1,015 | 1,069 | 1,101 | 1,120 |
| 2014 | 1,019 | 1,018 | 1,044 | 1,059 | 1,075 | 1,109 | 1,106 | 1,068 | 1,076 | 1,060 | 1,077 | 1,153 |
| 2015 | 1,074 | 1,067 | 1,070 | 1,083 | 1,125 | 1,165 | 1,141 | 1,120 | 1,108 | 1,122 | 1,136 | 1,144 |
| 2016 | 1,129 | 1,149 | 1,165 | 1,113 | 1,165 | 1,199 | 1,199 | 1,208 | 1,185 | 1,172 | 1,214 | 1,231 |
| 2017 | 1,206 | 1,192 | 1,199 | 1,160 | 1,197 | 1,209 | 1,212 | 1,240 | 1,198 | 1,232 | 1,285 | 1,257 |
| 2018 | 1,226 | 1,244 | 1,229 | 1,221 | 1,246 | 1,275 | 1,290 | 1,306 | 1,229 | 1,234 | 1,256 | 1,239 |
| 2019 | 1,130 | 1,132 | 1,104 | 1,153 | 1,166 | 1,176 | 1,172 | 1,149 | 1,087 | 1,109 | 1,146 | 1,175 |
| 2020 | 1,179 | 1,160 | 1,065 | 681 | 800 | 985 | 1,050 | 1,042 | 1,052 | 1,076 | 1,118 | 1,093 |
| 2021 | 1,089 | 961 | 1,111 | 1,102 | 1,176 | 1,187 | 1,194 | 1,116 | 1,094 | 1,225 | 1,274 | 1,283 |
| 2022 | 1,225 | 1,201 | 1,213 | 1,171 | 1,221 | 1,262 | 1,242 | 1,204 | 1,139 | 1,241 | 1,298 | 1,208 |
| 2023 | 1,258 | 1,257 | 1,271 | 1,254 | 1,312 | 1,363 | 1,329 | 1,320 | 1,343 | 1,326 | 1,358 | 1,418 |
| 2024 | 1,289 | |||||||||||
| - = No Data Reported; -- = Not Applicable; NA = Not Available; W = Withheld to avoid disclosure of individual company data. |
| Release Date: 3/29/2024 |
| Next Release Date: 4/30/2024 |