|
Download Data (XLS File) |
|
||||||||
|
||||||||
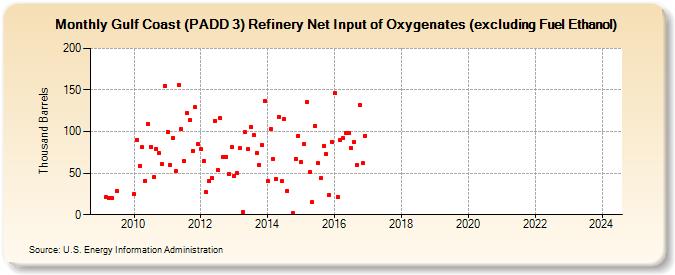
| Gulf Coast (PADD 3) Refinery Net Input of Oxygenates (excluding Fuel Ethanol) (Thousand Barrels) | ||||||||
| Year | Jan | Feb | Mar | Apr | May | Jun | Jul | Aug | Sep | Oct | Nov | Dec |
|---|---|---|---|---|---|---|---|---|---|---|---|---|
| 2009 | 21 | 20 | 20 | 29 | ||||||||
| 2010 | 25 | 90 | 59 | 81 | 41 | 109 | 82 | 45 | 79 | 74 | 61 | 155 |
| 2011 | 100 | 60 | 92 | 52 | 156 | 103 | 64 | 122 | 114 | 77 | 129 | 85 |
| 2012 | 79 | 64 | 27 | 40 | 44 | 113 | 54 | 116 | 69 | 70 | 49 | 81 |
| 2013 | 47 | 50 | 80 | 3 | 99 | 79 | 106 | 96 | 74 | 60 | 84 | 137 |
| 2014 | 40 | 103 | 67 | 43 | 118 | 40 | 115 | 29 | 2 | 67 | 95 | |
| 2015 | 63 | 85 | 135 | 51 | 15 | 107 | 62 | 44 | 83 | 73 | 24 | 88 |
| 2016 | 146 | 21 | 90 | 92 | 98 | 98 | 80 | 88 | 60 | 132 | 62 | 95 |
| 2017 | 76 | 122 | 120 | 76 | ||||||||
| 2019 | -- | -- | -- | -- | -- | -- | -- | -- | -- | -- | -- | -- |
| 2020 | -- | -- | -- | -- | -- | -- | -- | -- | -- | -- | -- | -- |
| 2021 | -- | -- | -- | -- | -- | -- | -- | -- | -- | -- | -- | |
| 2022 | -- | -- | -- | -- | -- | -- | -- | -- | -- | -- | -- | -- |
| 2023 | -- | -- | -- | -- | -- | -- | -- | -- | -- | -- | -- | -- |
| 2024 | -- | -- | -- | -- | -- | -- | ||||||
| - = No Data Reported; -- = Not Applicable; NA = Not Available; W = Withheld to avoid disclosure of individual company data. |
| Release Date: 8/30/2024 |
| Next Release Date: 9/30/2024 |