|
Download Data (XLS File) |
|
||||||||
|
||||||||
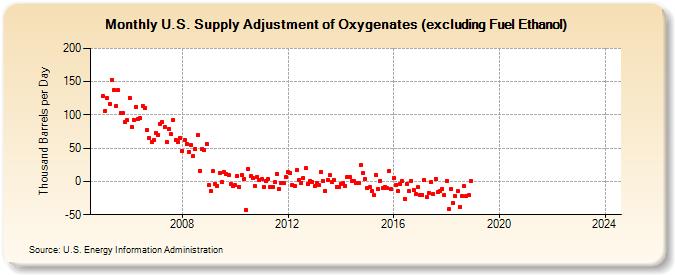
| U.S. Supply Adjustment of Oxygenates (excluding Fuel Ethanol) (Thousand Barrels per Day) | ||||||||
| Year | Jan | Feb | Mar | Apr | May | Jun | Jul | Aug | Sep | Oct | Nov | Dec |
|---|---|---|---|---|---|---|---|---|---|---|---|---|
| 2005 | 128 | 106 | 125 | 117 | 153 | 138 | 114 | 137 | 103 | 103 | 89 | 92 |
| 2006 | 126 | 82 | 93 | 112 | 94 | 95 | 114 | 111 | 77 | 65 | 60 | 62 |
| 2007 | 73 | 70 | 87 | 89 | 82 | 59 | 79 | 71 | 92 | 62 | 59 | 65 |
| 2008 | 46 | 62 | 57 | 45 | 55 | 38 | 49 | 70 | 16 | 49 | 47 | 57 |
| 2009 | -6 | -14 | 15 | -4 | -7 | 13 | -1 | 14 | 11 | 9 | -4 | -7 |
| 2010 | -6 | 8 | -8 | 10 | 4 | -43 | 19 | 8 | 5 | -7 | 7 | 2 |
| 2011 | 3 | -8 | 0 | 3 | -9 | -8 | -1 | 11 | -11 | -3 | -2 | 6 |
| 2012 | 14 | 13 | -5 | -7 | 17 | 2 | -2 | 5 | 20 | -4 | 1 | -1 |
| 2013 | -7 | -2 | -5 | 14 | 0 | -14 | 2 | 9 | -1 | 2 | -8 | -9 |
| 2014 | -4 | -3 | -7 | 6 | 7 | 1 | 0 | -2 | -3 | 24 | 13 | 4 |
| 2015 | -10 | -9 | -15 | -21 | 9 | -12 | 1 | -10 | -8 | -10 | 16 | -12 |
| 2016 | 5 | -5 | -15 | -4 | 0 | -26 | -4 | -15 | 1 | -13 | -19 | -9 |
| 2017 | -21 | -20 | 2 | -24 | -17 | -1 | -19 | 4 | -16 | -15 | -11 | -21 |
| 2018 | 0 | -42 | -11 | -32 | -22 | -15 | -38 | -22 | -7 | -22 | -21 | 0 |
| 2019 | -- | -- | -- | -- | -- | -- | -- | -- | -- | -- | -- | -- |
| 2020 | -- | -- | -- | -- | -- | -- | -- | -- | -- | -- | -- | -- |
| 2021 | -- | -- | -- | -- | -- | -- | -- | -- | -- | -- | -- | |
| 2022 | -- | -- | -- | -- | -- | -- | -- | -- | -- | -- | -- | -- |
| 2023 | -- | -- | -- | -- | -- | -- | -- | -- | -- | -- | -- | -- |
| 2024 | -- | -- | -- | -- | -- | -- | ||||||
| - = No Data Reported; -- = Not Applicable; NA = Not Available; W = Withheld to avoid disclosure of individual company data. |
| Release Date: 8/30/2024 |
| Next Release Date: 9/30/2024 |