|
Download Data (XLS File) |
|
||||||||
|
||||||||
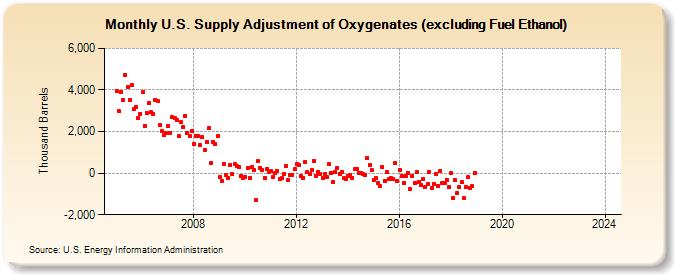
| U.S. Supply Adjustment of Oxygenates (excluding Fuel Ethanol) (Thousand Barrels) | ||||||||
| Year | Jan | Feb | Mar | Apr | May | Jun | Jul | Aug | Sep | Oct | Nov | Dec |
|---|---|---|---|---|---|---|---|---|---|---|---|---|
| 2005 | 3,961 | 2,970 | 3,886 | 3,508 | 4,737 | 4,130 | 3,537 | 4,233 | 3,081 | 3,184 | 2,667 | 2,859 |
| 2006 | 3,902 | 2,290 | 2,884 | 3,368 | 2,919 | 2,856 | 3,522 | 3,446 | 2,314 | 2,008 | 1,811 | 1,915 |
| 2007 | 2,270 | 1,948 | 2,688 | 2,667 | 2,539 | 1,784 | 2,442 | 2,214 | 2,764 | 1,935 | 1,764 | 2,029 |
| 2008 | 1,412 | 1,797 | 1,782 | 1,350 | 1,718 | 1,129 | 1,518 | 2,165 | 482 | 1,514 | 1,406 | 1,779 |
| 2009 | -194 | -384 | 458 | -113 | -220 | 403 | -44 | 427 | 321 | 294 | -124 | -219 |
| 2010 | -193 | 235 | -244 | 302 | 139 | -1,296 | 584 | 247 | 143 | -211 | 218 | 58 |
| 2011 | 81 | -210 | 7 | 94 | -283 | -243 | -22 | 340 | -341 | -82 | -69 | 185 |
| 2012 | 426 | 388 | -158 | -214 | 526 | 52 | -47 | 145 | 602 | -119 | 34 | -36 |
| 2013 | -227 | -56 | -169 | 419 | 2 | -412 | 69 | 266 | -19 | 60 | -236 | -282 |
| 2014 | -117 | -88 | -213 | 177 | 209 | 18 | 3 | -62 | -84 | 748 | 377 | 131 |
| 2015 | -315 | -247 | -465 | -628 | 293 | -366 | 43 | -295 | -248 | -303 | 494 | -387 |
| 2016 | 159 | -150 | -452 | -133 | 13 | -777 | -132 | -472 | 34 | -409 | -567 | -279 |
| 2017 | -660 | -546 | 72 | -716 | -519 | -34 | -600 | 114 | -476 | -470 | -317 | -659 |
| 2018 | 6 | -1,175 | -335 | -966 | -669 | -438 | -1,187 | -674 | -206 | -694 | -619 | 8 |
| 2019 | -- | -- | -- | -- | -- | -- | -- | -- | -- | -- | -- | -- |
| 2020 | -- | -- | -- | -- | -- | -- | -- | -- | -- | -- | -- | -- |
| 2021 | -- | -- | -- | -- | -- | -- | -- | -- | -- | -- | -- | |
| 2022 | -- | -- | -- | -- | -- | -- | -- | -- | -- | -- | -- | -- |
| 2023 | -- | -- | -- | -- | -- | -- | -- | -- | -- | -- | -- | -- |
| 2024 | -- | |||||||||||
| - = No Data Reported; -- = Not Applicable; NA = Not Available; W = Withheld to avoid disclosure of individual company data. |
| Release Date: 3/29/2024 |
| Next Release Date: 4/30/2024 |