|
Download Data (XLS File) |
|
||||||||
|
||||||||
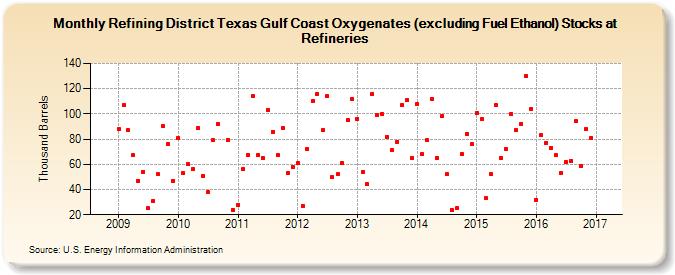
| Refining District Texas Gulf Coast Oxygenates (excluding Fuel Ethanol) Stocks at Refineries (Thousand Barrels) | ||||||||
| Year | Jan | Feb | Mar | Apr | May | Jun | Jul | Aug | Sep | Oct | Nov | Dec |
|---|---|---|---|---|---|---|---|---|---|---|---|---|
| 2009 | 88 | 107 | 87 | 67 | 47 | 54 | 25 | 31 | 52 | 90 | 76 | 47 |
| 2010 | 81 | 53 | 60 | 56 | 89 | 51 | 38 | 79 | 92 | 79 | 24 | |
| 2011 | 28 | 56 | 67 | 114 | 67 | 65 | 103 | 86 | 67 | 89 | 53 | 58 |
| 2012 | 61 | 27 | 72 | 110 | 116 | 87 | 114 | 50 | 52 | 61 | 95 | 112 |
| 2013 | 96 | 54 | 44 | 116 | 99 | 100 | 82 | 71 | 78 | 107 | 111 | 65 |
| 2014 | 108 | 68 | 79 | 112 | 65 | 98 | 52 | 24 | 25 | 68 | 84 | 76 |
| 2015 | 101 | 96 | 33 | 52 | 107 | 65 | 72 | 100 | 87 | 92 | 130 | 104 |
| 2016 | 32 | 83 | 77 | 73 | 67 | 53 | 62 | 63 | 94 | 59 | 88 | 81 |
| 2017 | 93 | 63 | 51 | 70 | ||||||||
| - = No Data Reported; -- = Not Applicable; NA = Not Available; W = Withheld to avoid disclosure of individual company data. |
| Release Date: 3/29/2024 |
| Next Release Date: 4/30/2024 |