|
Download Data (XLS File) |
|
||||||||
|
||||||||
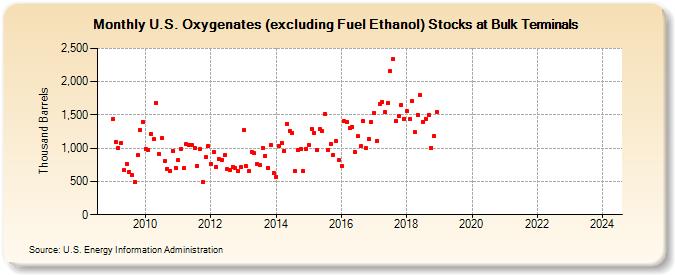
| U.S. Oxygenates (excluding Fuel Ethanol) Stocks at Bulk Terminals (Thousand Barrels) | ||||||||
| Year | Jan | Feb | Mar | Apr | May | Jun | Jul | Aug | Sep | Oct | Nov | Dec |
|---|---|---|---|---|---|---|---|---|---|---|---|---|
| 2009 | 1,436 | 1,093 | 1,009 | 1,083 | 668 | 765 | 648 | 593 | 490 | 895 | 1,278 | 1,396 |
| 2010 | 993 | 980 | 1,219 | 1,138 | 1,683 | 913 | 1,154 | 804 | 694 | 662 | 958 | 707 |
| 2011 | 823 | 992 | 697 | 1,063 | 1,047 | 1,041 | 1,010 | 732 | 981 | 491 | 860 | 1,027 |
| 2012 | 761 | 949 | 718 | 834 | 827 | 892 | 682 | 676 | 723 | 697 | 660 | 724 |
| 2013 | 1,274 | 727 | 657 | 947 | 923 | 764 | 753 | 1,007 | 888 | 707 | 1,053 | 630 |
| 2014 | 568 | 1,038 | 1,084 | 961 | 1,368 | 1,256 | 1,231 | 652 | 975 | 993 | 651 | 994 |
| 2015 | 1,047 | 1,293 | 1,234 | 966 | 1,282 | 1,254 | 1,517 | 974 | 1,069 | 903 | 1,103 | 823 |
| 2016 | 739 | 1,402 | 1,391 | 1,299 | 1,321 | 940 | 1,177 | 1,029 | 1,404 | 997 | 1,136 | 1,396 |
| 2017 | 1,529 | 1,114 | 1,661 | 1,697 | 1,544 | 1,679 | 2,155 | 2,339 | 1,412 | 1,488 | 1,648 | 1,446 |
| 2018 | 1,552 | 1,436 | 1,712 | 1,239 | 1,504 | 1,796 | 1,399 | 1,446 | 1,502 | 1,010 | 1,180 | 1,551 |
| 2019 | -- | -- | -- | -- | -- | -- | -- | -- | -- | -- | -- | -- |
| 2020 | -- | -- | -- | -- | -- | -- | -- | -- | -- | -- | -- | -- |
| 2021 | -- | -- | -- | -- | -- | -- | -- | -- | -- | -- | -- | |
| 2022 | -- | -- | -- | -- | -- | -- | -- | -- | -- | -- | -- | -- |
| 2023 | -- | -- | -- | -- | -- | -- | -- | -- | -- | -- | -- | -- |
| 2024 | -- | |||||||||||
| - = No Data Reported; -- = Not Applicable; NA = Not Available; W = Withheld to avoid disclosure of individual company data. |
| Release Date: 3/29/2024 |
| Next Release Date: 4/30/2024 |