|
Download Data (XLS File) |
|
||||||||
|
||||||||
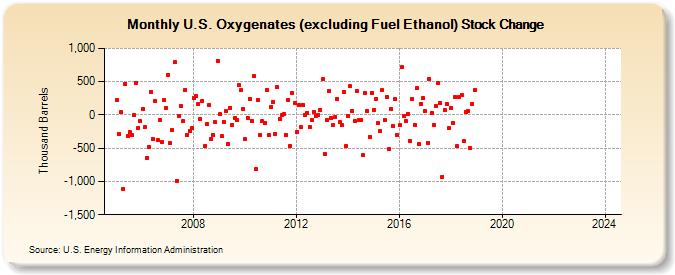
| U.S. Oxygenates (excluding Fuel Ethanol) Stock Change (Thousand Barrels) | ||||||||
| Year | Jan | Feb | Mar | Apr | May | Jun | Jul | Aug | Sep | Oct | Nov | Dec |
|---|---|---|---|---|---|---|---|---|---|---|---|---|
| 2005 | 217 | -282 | 43 | -1,117 | 469 | -313 | -262 | -296 | 1 | 487 | -192 | -96 |
| 2006 | 87 | -187 | -641 | -481 | 346 | -364 | 203 | -379 | -78 | -407 | 217 | 104 |
| 2007 | 604 | -423 | -229 | 790 | -987 | -13 | 134 | -92 | 381 | -304 | -238 | -204 |
| 2008 | 259 | 280 | 166 | -61 | 210 | -474 | -136 | 150 | -362 | -295 | -111 | 813 |
| 2009 | 10 | -324 | -104 | 54 | -435 | 104 | -146 | -49 | -82 | 443 | 369 | 89 |
| 2010 | -369 | -41 | 246 | -85 | 578 | -808 | 228 | -309 | -97 | -124 | 375 | -306 |
| 2011 | 120 | 197 | -284 | 413 | -63 | -8 | 7 | -295 | 230 | -468 | 333 | 172 |
| 2012 | -263 | 154 | -186 | 154 | -1 | 36 | -183 | -70 | 49 | -17 | -3 | 81 |
| 2013 | 534 | -589 | -80 | 362 | -41 | -158 | -29 | 243 | -112 | -152 | 350 | -469 |
| 2014 | -19 | 430 | 57 | -90 | 360 | -79 | -71 | -607 | 324 | 61 | -326 | 335 |
| 2015 | 78 | 241 | -122 | -249 | 371 | -70 | 270 | -515 | 82 | -161 | 238 | -306 |
| 2016 | -156 | 714 | -17 | -96 | 16 | -395 | 246 | -147 | 406 | -442 | 168 | 253 |
| 2017 | 52 | -415 | 547 | 36 | -153 | 135 | 476 | 184 | -927 | 76 | 160 | -202 |
| 2018 | 106 | -116 | 276 | -473 | 265 | 292 | -397 | 47 | 56 | -492 | 170 | 371 |
| 2019 | -- | -- | -- | -- | -- | -- | -- | -- | -- | -- | -- | -- |
| 2020 | -- | -- | -- | -- | -- | -- | -- | -- | -- | -- | -- | -- |
| 2021 | -- | -- | -- | -- | -- | -- | -- | -- | -- | -- | -- | |
| 2022 | -- | -- | -- | -- | -- | -- | -- | -- | -- | -- | -- | -- |
| 2023 | -- | -- | -- | -- | -- | -- | -- | -- | -- | -- | -- | -- |
| 2024 | -- | |||||||||||
| - = No Data Reported; -- = Not Applicable; NA = Not Available; W = Withheld to avoid disclosure of individual company data. |
| Release Date: 3/29/2024 |
| Next Release Date: 4/30/2024 |