|
Download Data (XLS File) |
|
||||||||
|
||||||||
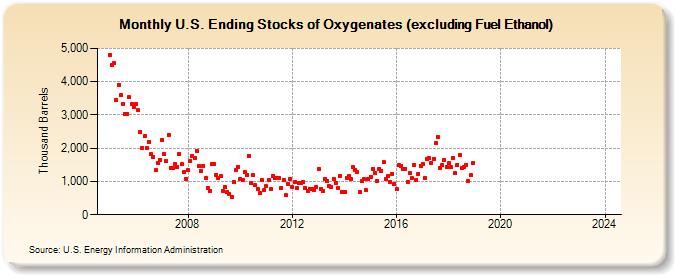
| U.S. Ending Stocks of Oxygenates (excluding Fuel Ethanol) (Thousand Barrels) | ||||||||
| Year | Jan | Feb | Mar | Apr | May | Jun | Jul | Aug | Sep | Oct | Nov | Dec |
|---|---|---|---|---|---|---|---|---|---|---|---|---|
| 2005 | 4,794 | 4,512 | 4,555 | 3,438 | 3,907 | 3,594 | 3,332 | 3,036 | 3,037 | 3,524 | 3,332 | 3,236 |
| 2006 | 3,323 | 3,136 | 2,495 | 2,014 | 2,360 | 1,996 | 2,199 | 1,820 | 1,742 | 1,335 | 1,552 | 1,656 |
| 2007 | 2,260 | 1,837 | 1,608 | 2,398 | 1,411 | 1,398 | 1,532 | 1,440 | 1,821 | 1,517 | 1,279 | 1,075 |
| 2008 | 1,334 | 1,614 | 1,780 | 1,719 | 1,929 | 1,455 | 1,319 | 1,469 | 1,107 | 812 | 701 | 1,514 |
| 2009 | 1,524 | 1,200 | 1,096 | 1,150 | 715 | 819 | 673 | 624 | 542 | 985 | 1,354 | 1,443 |
| 2010 | 1,074 | 1,033 | 1,279 | 1,194 | 1,772 | 964 | 1,192 | 883 | 786 | 662 | 1,037 | 731 |
| 2011 | 851 | 1,048 | 764 | 1,177 | 1,114 | 1,106 | 1,113 | 818 | 1,048 | 580 | 913 | 1,085 |
| 2012 | 822 | 976 | 790 | 944 | 943 | 979 | 796 | 726 | 775 | 758 | 755 | 836 |
| 2013 | 1,370 | 781 | 701 | 1,063 | 1,022 | 864 | 835 | 1,078 | 966 | 814 | 1,164 | 695 |
| 2014 | 676 | 1,106 | 1,163 | 1,073 | 1,433 | 1,354 | 1,283 | 676 | 1,000 | 1,061 | 735 | 1,070 |
| 2015 | 1,148 | 1,389 | 1,267 | 1,018 | 1,389 | 1,319 | 1,589 | 1,074 | 1,156 | 995 | 1,233 | 927 |
| 2016 | 771 | 1,485 | 1,468 | 1,372 | 1,388 | 993 | 1,239 | 1,092 | 1,498 | 1,056 | 1,224 | 1,477 |
| 2017 | 1,529 | 1,114 | 1,661 | 1,697 | 1,544 | 1,679 | 2,155 | 2,339 | 1,412 | 1,488 | 1,648 | 1,446 |
| 2018 | 1,552 | 1,436 | 1,712 | 1,239 | 1,504 | 1,796 | 1,399 | 1,446 | 1,502 | 1,010 | 1,180 | 1,551 |
| 2019 | -- | -- | -- | -- | -- | -- | -- | -- | -- | -- | -- | -- |
| 2020 | -- | -- | -- | -- | -- | -- | -- | -- | -- | -- | -- | -- |
| 2021 | -- | -- | -- | -- | -- | -- | -- | -- | -- | -- | -- | |
| 2022 | -- | -- | -- | -- | -- | -- | -- | -- | -- | -- | -- | -- |
| 2023 | -- | -- | -- | -- | -- | -- | -- | -- | -- | -- | -- | -- |
| 2024 | -- | |||||||||||
| - = No Data Reported; -- = Not Applicable; NA = Not Available; W = Withheld to avoid disclosure of individual company data. |
| Release Date: 3/29/2024 |
| Next Release Date: 4/30/2024 |