|
Download Data (XLS File) |
|
||||||||
|
||||||||
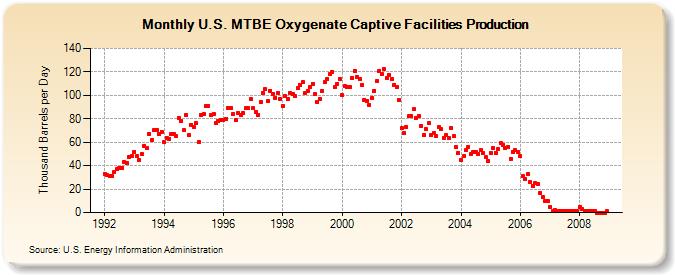
| U.S. MTBE Oxygenate Captive Facilities Production (Thousand Barrels per Day) | ||||||||
| Year | Jan | Feb | Mar | Apr | May | Jun | Jul | Aug | Sep | Oct | Nov | Dec |
|---|---|---|---|---|---|---|---|---|---|---|---|---|
| 1992 | 33 | 32 | 31 | 31 | 35 | 37 | 38 | 38 | 43 | 42 | 47 | 48 |
| 1993 | 52 | 48 | 45 | 50 | 57 | 55 | 67 | 62 | 70 | 70 | 67 | 69 |
| 1994 | 60 | 64 | 63 | 67 | 67 | 65 | 81 | 78 | 70 | 83 | 66 | 75 |
| 1995 | 73 | 76 | 60 | 83 | 84 | 91 | 91 | 83 | 84 | 76 | 78 | 79 |
| 1996 | 79 | 80 | 89 | 89 | 84 | 79 | 85 | 83 | 85 | 89 | 89 | 97 |
| 1997 | 89 | 86 | 83 | 94 | 102 | 105 | 95 | 104 | 101 | 98 | 102 | 97 |
| 1998 | 91 | 99 | 97 | 102 | 101 | 99 | 106 | 109 | 111 | 102 | 104 | 107 |
| 1999 | 110 | 101 | 94 | 97 | 104 | 111 | 114 | 118 | 120 | 107 | 110 | 114 |
| 2000 | 100 | 108 | 107 | 107 | 115 | 121 | 116 | 114 | 109 | 96 | 95 | 92 |
| 2001 | 98 | 104 | 112 | 121 | 118 | 122 | 115 | 117 | 114 | 109 | 107 | 96 |
| 2002 | 72 | 68 | 73 | 82 | 82 | 88 | 81 | 82 | 74 | 66 | 71 | 76 |
| 2003 | 66 | 68 | 65 | 73 | 71 | 64 | 66 | 64 | 72 | 65 | 56 | 51 |
| 2004 | 45 | 48 | 53 | 56 | 50 | 52 | 52 | 50 | 53 | 51 | 47 | 44 |
| 2005 | 51 | 55 | 51 | 54 | 59 | 58 | 55 | 56 | 46 | 52 | 53 | 52 |
| 2006 | 48 | 31 | 29 | 33 | 26 | 23 | 25 | 24 | 17 | 13 | 10 | 10 |
| 2007 | 5 | 1 | 2 | 1 | 1 | 1 | 1 | 1 | 1 | 1 | 1 | 1 |
| 2008 | 5 | 3 | 1 | 1 | 1 | 1 | 1 | 0 | 0 | 0 | 0 | 1 |
| - = No Data Reported; -- = Not Applicable; NA = Not Available; W = Withheld to avoid disclosure of individual company data. |
| Release Date: 3/29/2024 |
| Next Release Date: 4/30/2024 |