|
Download Data (XLS File) |
|
||||||||
|
||||||||
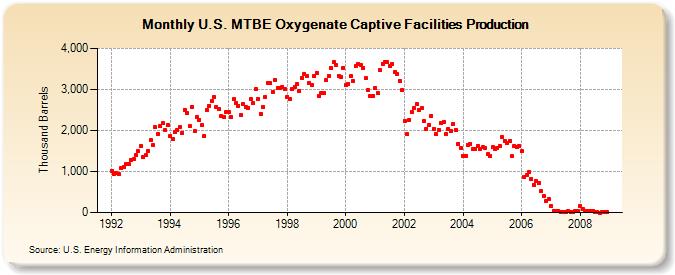
| U.S. MTBE Oxygenate Captive Facilities Production (Thousand Barrels) | ||||||||
| Year | Jan | Feb | Mar | Apr | May | Jun | Jul | Aug | Sep | Oct | Nov | Dec |
|---|---|---|---|---|---|---|---|---|---|---|---|---|
| 1992 | 1,023 | 928 | 961 | 930 | 1,085 | 1,110 | 1,178 | 1,178 | 1,290 | 1,302 | 1,410 | 1,488 |
| 1993 | 1,612 | 1,344 | 1,395 | 1,500 | 1,767 | 1,650 | 2,077 | 1,922 | 2,100 | 2,170 | 2,010 | 2,139 |
| 1994 | 1,860 | 1,792 | 1,953 | 2,010 | 2,077 | 1,950 | 2,511 | 2,418 | 2,100 | 2,573 | 1,980 | 2,325 |
| 1995 | 2,263 | 2,128 | 1,860 | 2,490 | 2,604 | 2,730 | 2,821 | 2,573 | 2,520 | 2,356 | 2,340 | 2,449 |
| 1996 | 2,449 | 2,320 | 2,759 | 2,670 | 2,604 | 2,370 | 2,635 | 2,573 | 2,550 | 2,759 | 2,670 | 3,007 |
| 1997 | 2,759 | 2,408 | 2,573 | 2,820 | 3,162 | 3,150 | 2,945 | 3,224 | 3,030 | 3,038 | 3,060 | 3,007 |
| 1998 | 2,821 | 2,772 | 3,007 | 3,060 | 3,131 | 2,970 | 3,286 | 3,379 | 3,330 | 3,162 | 3,120 | 3,317 |
| 1999 | 3,410 | 2,828 | 2,914 | 2,910 | 3,224 | 3,330 | 3,534 | 3,658 | 3,600 | 3,317 | 3,300 | 3,534 |
| 2000 | 3,100 | 3,132 | 3,317 | 3,210 | 3,565 | 3,630 | 3,596 | 3,534 | 3,270 | 2,976 | 2,850 | 2,852 |
| 2001 | 3,038 | 2,912 | 3,472 | 3,630 | 3,658 | 3,660 | 3,565 | 3,627 | 3,420 | 3,379 | 3,210 | 2,976 |
| 2002 | 2,232 | 1,904 | 2,263 | 2,460 | 2,542 | 2,640 | 2,511 | 2,542 | 2,220 | 2,046 | 2,130 | 2,356 |
| 2003 | 2,046 | 1,904 | 2,015 | 2,190 | 2,201 | 1,920 | 2,046 | 1,984 | 2,160 | 2,015 | 1,680 | 1,581 |
| 2004 | 1,386 | 1,383 | 1,656 | 1,674 | 1,542 | 1,550 | 1,617 | 1,550 | 1,587 | 1,584 | 1,415 | 1,378 |
| 2005 | 1,588 | 1,545 | 1,580 | 1,625 | 1,839 | 1,751 | 1,695 | 1,742 | 1,370 | 1,615 | 1,600 | 1,620 |
| 2006 | 1,490 | 871 | 910 | 984 | 821 | 680 | 762 | 730 | 514 | 404 | 292 | 322 |
| 2007 | 158 | 41 | 47 | 44 | 19 | 20 | 23 | 28 | 20 | 24 | 28 | 28 |
| 2008 | 157 | 90 | 29 | 29 | 41 | 33 | 19 | 3 | 1 | 3 | 3 | 25 |
| - = No Data Reported; -- = Not Applicable; NA = Not Available; W = Withheld to avoid disclosure of individual company data. |
| Release Date: 3/29/2024 |
| Next Release Date: 4/30/2024 |