|
Download Data (XLS File) |
|
||||||||
|
||||||||
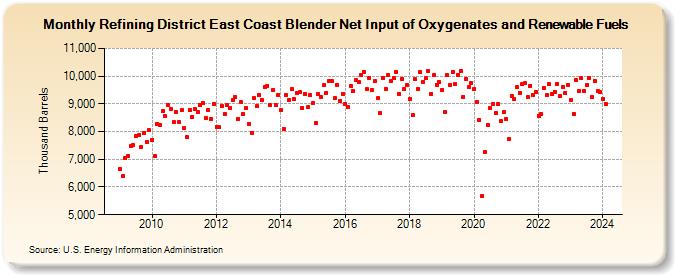
| Refining District East Coast Blender Net Input of Oxygenates and Renewable Fuels (Thousand Barrels) | ||||||||
| Year | Jan | Feb | Mar | Apr | May | Jun | Jul | Aug | Sep | Oct | Nov | Dec |
|---|---|---|---|---|---|---|---|---|---|---|---|---|
| 2009 | 6,664 | 6,386 | 7,031 | 7,107 | 7,475 | 7,497 | 7,838 | 7,860 | 7,454 | 7,952 | 7,621 | 8,054 |
| 2010 | 7,709 | 7,116 | 8,287 | 8,248 | 8,730 | 8,545 | 8,945 | 8,804 | 8,338 | 8,716 | 8,340 | 8,762 |
| 2011 | 8,119 | 7,808 | 8,769 | 8,537 | 8,799 | 8,718 | 8,953 | 9,021 | 8,478 | 8,766 | 8,455 | 9,005 |
| 2012 | 8,172 | 8,151 | 8,916 | 8,627 | 8,957 | 8,858 | 9,135 | 9,229 | 8,460 | 9,060 | 8,620 | 8,841 |
| 2013 | 8,290 | 7,960 | 9,200 | 8,905 | 9,319 | 9,136 | 9,600 | 9,657 | 8,942 | 9,499 | 8,973 | 9,328 |
| 2014 | 8,763 | 8,108 | 9,304 | 9,154 | 9,522 | 9,164 | 9,387 | 9,419 | 8,865 | 9,368 | 8,871 | 9,313 |
| 2015 | 9,018 | 8,315 | 9,356 | 9,247 | 9,675 | 9,406 | 9,821 | 9,814 | 9,201 | 9,681 | 9,105 | 9,346 |
| 2016 | 9,011 | 8,878 | 9,646 | 9,448 | 9,857 | 9,801 | 10,028 | 10,151 | 9,520 | 9,944 | 9,517 | 9,822 |
| 2017 | 9,197 | 8,670 | 9,934 | 9,544 | 10,037 | 9,825 | 9,937 | 10,158 | 9,360 | 9,896 | 9,526 | 9,681 |
| 2018 | 9,164 | 8,600 | 9,882 | 9,550 | 10,139 | 9,795 | 9,923 | 10,185 | 9,367 | 10,024 | 9,691 | 9,784 |
| 2019 | 9,512 | 8,698 | 10,036 | 9,688 | 10,160 | 9,712 | 10,046 | 10,179 | 9,242 | 9,901 | 9,615 | 9,741 |
| 2020 | 9,535 | 9,080 | 8,419 | 5,683 | 7,246 | 8,236 | 8,850 | 8,989 | 8,655 | 8,991 | 8,369 | 8,691 |
| 2021 | 8,448 | 7,747 | 9,284 | 9,192 | 9,594 | 9,407 | 9,719 | 9,736 | 9,233 | 9,658 | 9,335 | 9,439 |
| 2022 | 8,569 | 8,628 | 9,583 | 9,312 | 9,711 | 9,337 | 9,436 | 9,728 | 9,270 | 9,625 | 9,397 | 9,674 |
| 2023 | 9,141 | 8,649 | 9,857 | 9,460 | 9,920 | 9,478 | 9,696 | 9,924 | 9,249 | 9,830 | 9,461 | 9,414 |
| 2024 | 9,189 | 9,011 | ||||||||||
| - = No Data Reported; -- = Not Applicable; NA = Not Available; W = Withheld to avoid disclosure of individual company data. |
| Release Date: 4/30/2024 |
| Next Release Date: 5/31/2024 |
Referring Pages: