|
Download Data (XLS File) |
|
||||||||
|
||||||||
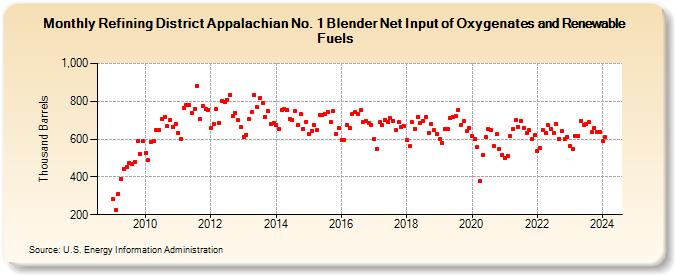
| Refining District Appalachian No. 1 Blender Net Input of Oxygenates and Renewable Fuels (Thousand Barrels) | ||||||||
| Year | Jan | Feb | Mar | Apr | May | Jun | Jul | Aug | Sep | Oct | Nov | Dec |
|---|---|---|---|---|---|---|---|---|---|---|---|---|
| 2009 | 281 | 224 | 311 | 388 | 444 | 453 | 472 | 467 | 481 | 588 | 523 | 588 |
| 2010 | 528 | 489 | 584 | 592 | 648 | 650 | 706 | 717 | 667 | 700 | 665 | 682 |
| 2011 | 634 | 599 | 764 | 783 | 781 | 737 | 761 | 881 | 706 | 774 | 760 | 756 |
| 2012 | 660 | 681 | 761 | 687 | 804 | 794 | 809 | 835 | 720 | 737 | 700 | 663 |
| 2013 | 613 | 623 | 705 | 742 | 833 | 768 | 815 | 791 | 717 | 749 | 678 | 684 |
| 2014 | 677 | 656 | 756 | 759 | 756 | 704 | 703 | 748 | 674 | 731 | 654 | 692 |
| 2015 | 629 | 644 | 672 | 649 | 730 | 727 | 731 | 743 | 688 | 748 | 626 | 661 |
| 2016 | 596 | 596 | 677 | 657 | 731 | 741 | 732 | 754 | 693 | 695 | 683 | 674 |
| 2017 | 599 | 549 | 689 | 672 | 702 | 693 | 712 | 696 | 648 | 688 | 666 | 670 |
| 2018 | 595 | 562 | 689 | 655 | 719 | 685 | 696 | 718 | 633 | 680 | 646 | 626 |
| 2019 | 599 | 580 | 653 | 654 | 712 | 716 | 723 | 754 | 675 | 695 | 641 | 660 |
| 2020 | 616 | 599 | 556 | 376 | 518 | 609 | 654 | 648 | 562 | 625 | 546 | 518 |
| 2021 | 502 | 513 | 614 | 654 | 701 | 666 | 694 | 660 | 632 | 646 | 602 | 622 |
| 2022 | 539 | 551 | 647 | 632 | 673 | 654 | 634 | 682 | 600 | 641 | 602 | 612 |
| 2023 | 565 | 546 | 615 | 619 | 696 | 674 | 682 | 689 | 636 | 661 | 639 | 636 |
| 2024 | 589 | |||||||||||
| - = No Data Reported; -- = Not Applicable; NA = Not Available; W = Withheld to avoid disclosure of individual company data. |
| Release Date: 3/29/2024 |
| Next Release Date: 4/30/2024 |