|
Download Data (XLS File) |
|
||||||||
|
||||||||
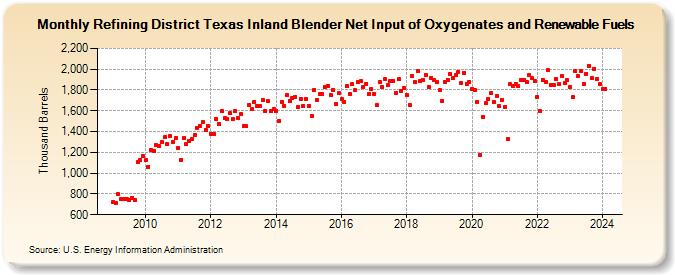
| Refining District Texas Inland Blender Net Input of Oxygenates and Renewable Fuels (Thousand Barrels) | ||||||||
| Year | Jan | Feb | Mar | Apr | May | Jun | Jul | Aug | Sep | Oct | Nov | Dec |
|---|---|---|---|---|---|---|---|---|---|---|---|---|
| 2009 | 721 | 714 | 799 | 750 | 753 | 752 | 743 | 762 | 745 | 1,106 | 1,124 | 1,163 |
| 2010 | 1,123 | 1,062 | 1,223 | 1,216 | 1,271 | 1,260 | 1,297 | 1,344 | 1,278 | 1,354 | 1,301 | 1,336 |
| 2011 | 1,246 | 1,128 | 1,334 | 1,279 | 1,310 | 1,324 | 1,369 | 1,433 | 1,457 | 1,490 | 1,414 | 1,450 |
| 2012 | 1,379 | 1,378 | 1,520 | 1,473 | 1,594 | 1,530 | 1,520 | 1,576 | 1,522 | 1,597 | 1,526 | 1,565 |
| 2013 | 1,451 | 1,449 | 1,657 | 1,614 | 1,687 | 1,650 | 1,649 | 1,702 | 1,599 | 1,691 | 1,593 | 1,613 |
| 2014 | 1,600 | 1,502 | 1,687 | 1,647 | 1,748 | 1,692 | 1,720 | 1,736 | 1,637 | 1,715 | 1,646 | 1,712 |
| 2015 | 1,649 | 1,550 | 1,802 | 1,708 | 1,759 | 1,763 | 1,833 | 1,843 | 1,755 | 1,799 | 1,669 | 1,767 |
| 2016 | 1,712 | 1,689 | 1,834 | 1,766 | 1,856 | 1,795 | 1,881 | 1,883 | 1,832 | 1,861 | 1,766 | 1,805 |
| 2017 | 1,763 | 1,653 | 1,879 | 1,830 | 1,903 | 1,847 | 1,885 | 1,889 | 1,775 | 1,903 | 1,793 | 1,816 |
| 2018 | 1,754 | 1,656 | 1,931 | 1,873 | 1,982 | 1,888 | 1,895 | 1,947 | 1,827 | 1,918 | 1,892 | 1,876 |
| 2019 | 1,795 | 1,697 | 1,881 | 1,900 | 1,956 | 1,916 | 1,940 | 1,973 | 1,871 | 1,968 | 1,862 | 1,880 |
| 2020 | 1,814 | 1,797 | 1,684 | 1,174 | 1,541 | 1,674 | 1,711 | 1,767 | 1,689 | 1,743 | 1,641 | 1,706 |
| 2021 | 1,633 | 1,331 | 1,857 | 1,837 | 1,860 | 1,836 | 1,900 | 1,900 | 1,875 | 1,943 | 1,911 | 1,883 |
| 2022 | 1,730 | 1,596 | 1,900 | 1,881 | 1,988 | 1,848 | 1,845 | 1,903 | 1,858 | 1,935 | 1,867 | 1,893 |
| 2023 | 1,827 | 1,728 | 1,982 | 1,936 | 1,979 | 1,856 | 1,958 | 2,032 | 1,917 | 2,003 | 1,901 | 1,856 |
| 2024 | 1,811 | |||||||||||
| - = No Data Reported; -- = Not Applicable; NA = Not Available; W = Withheld to avoid disclosure of individual company data. |
| Release Date: 3/29/2024 |
| Next Release Date: 4/30/2024 |
Referring Pages: