|
Download Data (XLS File) |
|
||||||||
|
||||||||
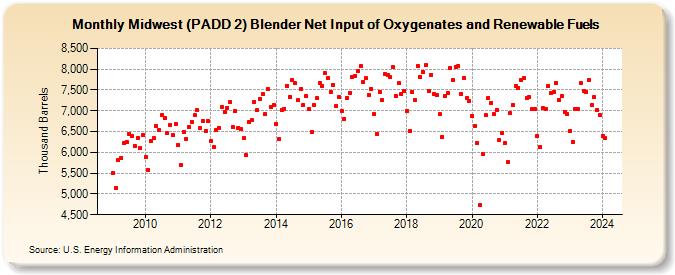
| Midwest (PADD 2) Blender Net Input of Oxygenates and Renewable Fuels (Thousand Barrels) | ||||||||
| Year | Jan | Feb | Mar | Apr | May | Jun | Jul | Aug | Sep | Oct | Nov | Dec |
|---|---|---|---|---|---|---|---|---|---|---|---|---|
| 2009 | 5,499 | 5,150 | 5,806 | 5,864 | 6,219 | 6,254 | 6,448 | 6,393 | 6,154 | 6,345 | 6,114 | 6,413 |
| 2010 | 5,891 | 5,581 | 6,276 | 6,342 | 6,630 | 6,540 | 6,901 | 6,829 | 6,457 | 6,662 | 6,408 | 6,686 |
| 2011 | 6,186 | 5,700 | 6,496 | 6,328 | 6,611 | 6,741 | 6,889 | 7,011 | 6,586 | 6,762 | 6,523 | 6,753 |
| 2012 | 6,264 | 6,118 | 6,549 | 6,591 | 7,102 | 6,965 | 7,075 | 7,206 | 6,615 | 6,999 | 6,596 | 6,560 |
| 2013 | 6,339 | 5,934 | 6,731 | 6,767 | 7,222 | 7,016 | 7,289 | 7,406 | 6,913 | 7,528 | 7,096 | 7,135 |
| 2014 | 6,681 | 6,309 | 7,021 | 7,053 | 7,605 | 7,341 | 7,738 | 7,661 | 7,253 | 7,518 | 7,136 | 7,353 |
| 2015 | 7,035 | 6,478 | 7,139 | 7,295 | 7,661 | 7,597 | 7,903 | 7,788 | 7,454 | 7,626 | 7,117 | 7,325 |
| 2016 | 6,998 | 6,813 | 7,314 | 7,437 | 7,809 | 7,838 | 7,959 | 8,078 | 7,692 | 7,781 | 7,385 | 7,534 |
| 2017 | 6,920 | 6,444 | 7,460 | 7,258 | 7,890 | 7,868 | 7,803 | 8,045 | 7,367 | 7,660 | 7,397 | 7,475 |
| 2018 | 6,992 | 6,519 | 7,453 | 7,255 | 8,084 | 7,807 | 7,931 | 8,096 | 7,477 | 7,872 | 7,410 | 7,378 |
| 2019 | 6,920 | 6,375 | 7,358 | 7,423 | 8,031 | 7,737 | 8,059 | 8,074 | 7,400 | 7,799 | 7,306 | 7,242 |
| 2020 | 6,884 | 6,633 | 6,236 | 4,730 | 5,950 | 6,889 | 7,312 | 7,198 | 6,921 | 7,030 | 6,300 | 6,462 |
| 2021 | 6,218 | 5,757 | 6,937 | 7,141 | 7,600 | 7,551 | 7,749 | 7,776 | 7,306 | 7,319 | 7,033 | 7,045 |
| 2022 | 6,384 | 6,131 | 7,055 | 7,032 | 7,590 | 7,417 | 7,461 | 7,673 | 7,253 | 7,344 | 6,979 | 6,922 |
| 2023 | 6,511 | 6,252 | 7,038 | 7,037 | 7,662 | 7,485 | 7,449 | 7,749 | 7,137 | 7,321 | 7,009 | 6,896 |
| 2024 | 6,400 | 6,336 | 6,900 | 7,122 | 7,710 | 7,337 | ||||||
| - = No Data Reported; -- = Not Applicable; NA = Not Available; W = Withheld to avoid disclosure of individual company data. |
| Release Date: 8/30/2024 |
| Next Release Date: 9/30/2024 |
Referring Pages: