|
Download Data (XLS File) |
|
||||||||
|
||||||||
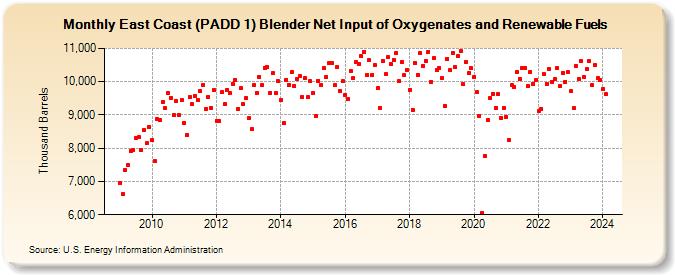
| East Coast (PADD 1) Blender Net Input of Oxygenates and Renewable Fuels (Thousand Barrels) | ||||||||
| Year | Jan | Feb | Mar | Apr | May | Jun | Jul | Aug | Sep | Oct | Nov | Dec |
|---|---|---|---|---|---|---|---|---|---|---|---|---|
| 2009 | 6,945 | 6,610 | 7,342 | 7,495 | 7,919 | 7,950 | 8,310 | 8,327 | 7,935 | 8,540 | 8,144 | 8,642 |
| 2010 | 8,237 | 7,605 | 8,871 | 8,840 | 9,378 | 9,195 | 9,651 | 9,521 | 9,005 | 9,416 | 9,005 | 9,444 |
| 2011 | 8,753 | 8,407 | 9,533 | 9,320 | 9,580 | 9,455 | 9,714 | 9,902 | 9,184 | 9,540 | 9,215 | 9,761 |
| 2012 | 8,832 | 8,832 | 9,677 | 9,314 | 9,761 | 9,652 | 9,944 | 10,064 | 9,180 | 9,797 | 9,320 | 9,504 |
| 2013 | 8,903 | 8,583 | 9,905 | 9,647 | 10,152 | 9,904 | 10,415 | 10,448 | 9,659 | 10,248 | 9,651 | 10,012 |
| 2014 | 9,440 | 8,764 | 10,060 | 9,913 | 10,278 | 9,868 | 10,090 | 10,167 | 9,539 | 10,099 | 9,525 | 10,005 |
| 2015 | 9,647 | 8,959 | 10,028 | 9,896 | 10,405 | 10,133 | 10,552 | 10,557 | 9,889 | 10,429 | 9,731 | 10,007 |
| 2016 | 9,607 | 9,474 | 10,323 | 10,105 | 10,588 | 10,542 | 10,760 | 10,905 | 10,213 | 10,639 | 10,200 | 10,496 |
| 2017 | 9,796 | 9,219 | 10,623 | 10,216 | 10,739 | 10,518 | 10,649 | 10,854 | 10,008 | 10,584 | 10,192 | 10,351 |
| 2018 | 9,759 | 9,162 | 10,571 | 10,205 | 10,858 | 10,480 | 10,619 | 10,903 | 10,000 | 10,704 | 10,337 | 10,410 |
| 2019 | 10,111 | 9,278 | 10,689 | 10,342 | 10,872 | 10,428 | 10,769 | 10,933 | 9,917 | 10,596 | 10,256 | 10,401 |
| 2020 | 10,151 | 9,679 | 8,975 | 6,059 | 7,764 | 8,845 | 9,504 | 9,637 | 9,217 | 9,616 | 8,915 | 9,209 |
| 2021 | 8,950 | 8,260 | 9,898 | 9,846 | 10,295 | 10,073 | 10,413 | 10,396 | 9,865 | 10,304 | 9,937 | 10,061 |
| 2022 | 9,108 | 9,179 | 10,230 | 9,944 | 10,384 | 9,991 | 10,070 | 10,410 | 9,870 | 10,266 | 9,999 | 10,286 |
| 2023 | 9,706 | 9,195 | 10,472 | 10,079 | 10,616 | 10,152 | 10,378 | 10,613 | 9,885 | 10,491 | 10,100 | 10,050 |
| 2024 | 9,778 | |||||||||||
| - = No Data Reported; -- = Not Applicable; NA = Not Available; W = Withheld to avoid disclosure of individual company data. |
| Release Date: 3/29/2024 |
| Next Release Date: 4/30/2024 |
Referring Pages: