|
Download Data (XLS File) |
|
||||||||
|
||||||||
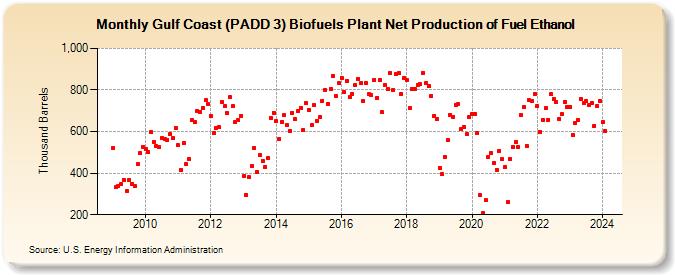
| Gulf Coast (PADD 3) Biofuels Plant Net Production of Fuel Ethanol (Thousand Barrels) | ||||||||
| Year | Jan | Feb | Mar | Apr | May | Jun | Jul | Aug | Sep | Oct | Nov | Dec |
|---|---|---|---|---|---|---|---|---|---|---|---|---|
| 2009 | 522 | 333 | 337 | 347 | 367 | 316 | 367 | 349 | 338 | 442 | 495 | 528 |
| 2010 | 517 | 500 | 597 | 551 | 531 | 525 | 571 | 563 | 561 | 587 | 567 | 618 |
| 2011 | 534 | 414 | 544 | 443 | 468 | 654 | 645 | 700 | 696 | 715 | 750 | 731 |
| 2012 | 676 | 592 | 617 | 620 | 744 | 721 | 688 | 764 | 721 | 648 | 654 | 675 |
| 2013 | 385 | 296 | 379 | 436 | 523 | 404 | 487 | 460 | 431 | 473 | 667 | 691 |
| 2014 | 649 | 565 | 647 | 678 | 633 | 604 | 691 | 658 | 700 | 715 | 608 | 737 |
| 2015 | 705 | 630 | 727 | 652 | 669 | 749 | 800 | 733 | 807 | 868 | 772 | 832 |
| 2016 | 859 | 788 | 845 | 765 | 781 | 822 | 855 | 832 | 746 | 833 | 780 | 775 |
| 2017 | 850 | 763 | 848 | 692 | 824 | 805 | 882 | 801 | 876 | 884 | 780 | 857 |
| 2018 | 847 | 711 | 805 | 803 | 824 | 828 | 884 | 832 | 817 | 773 | 675 | 658 |
| 2019 | 427 | 395 | 478 | 557 | 682 | 672 | 729 | 732 | 611 | 623 | 589 | 670 |
| 2020 | 684 | 686 | 591 | 294 | 210 | 269 | 479 | 496 | 449 | 417 | 508 | 467 |
| 2021 | 429 | 259 | 469 | 527 | 550 | 526 | 682 | 719 | 531 | 751 | 749 | 781 |
| 2022 | 724 | 600 | 657 | 712 | 657 | 779 | 758 | 740 | 661 | 683 | 741 | 719 |
| 2023 | 717 | 585 | 643 | 657 | 756 | 737 | 747 | 728 | 737 | 629 | 723 | 749 |
| 2024 | 644 | |||||||||||
| - = No Data Reported; -- = Not Applicable; NA = Not Available; W = Withheld to avoid disclosure of individual company data. |
| Release Date: 3/29/2024 |
| Next Release Date: 4/30/2024 |