|
Download Data (XLS File) |
|
||||||||
|
||||||||
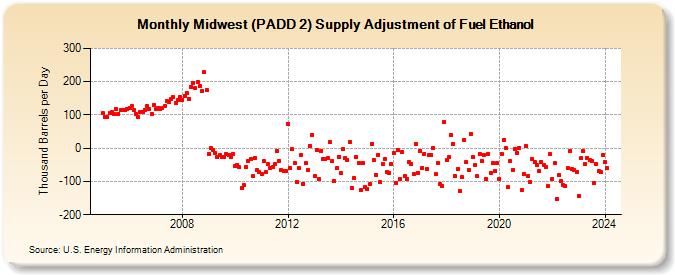
| Midwest (PADD 2) Supply Adjustment of Fuel Ethanol (Thousand Barrels per Day) | ||||||||
| Year | Jan | Feb | Mar | Apr | May | Jun | Jul | Aug | Sep | Oct | Nov | Dec |
|---|---|---|---|---|---|---|---|---|---|---|---|---|
| 2005 | 105 | 94 | 95 | 107 | 108 | 102 | 119 | 104 | 115 | 114 | 114 | 118 |
| 2006 | 121 | 126 | 114 | 104 | 93 | 110 | 108 | 115 | 127 | 117 | 103 | 130 |
| 2007 | 117 | 122 | 119 | 122 | 126 | 141 | 140 | 148 | 153 | 135 | 144 | 153 |
| 2008 | 146 | 157 | 166 | 149 | 185 | 197 | 181 | 200 | 188 | 171 | 228 | 174 |
| 2009 | -16 | 1 | -5 | -14 | -27 | -20 | -27 | -27 | -18 | -21 | -28 | -17 |
| 2010 | -55 | -50 | -58 | -119 | -111 | -58 | -39 | -33 | -84 | -29 | -67 | -73 |
| 2011 | -78 | -40 | -72 | -47 | -59 | -57 | -48 | -8 | -38 | -67 | -70 | -68 |
| 2012 | 73 | -59 | -3 | -44 | -101 | -61 | -19 | -107 | -45 | -67 | 8 | 40 |
| 2013 | -84 | -5 | -93 | -9 | -34 | -32 | -31 | 18 | -39 | -100 | -61 | -25 |
| 2014 | -76 | -3 | -31 | -36 | 18 | -119 | -89 | -27 | -44 | -126 | -44 | -118 |
| 2015 | -124 | -109 | 14 | -36 | -80 | -19 | -103 | -48 | -33 | -72 | -74 | -48 |
| 2016 | -14 | -105 | -4 | -94 | -11 | -85 | -92 | -41 | -47 | -78 | 12 | -74 |
| 2017 | -8 | -59 | -16 | -63 | -20 | -20 | 1 | -79 | -44 | -108 | -113 | 80 |
| 2018 | -36 | -27 | 41 | 14 | -85 | -62 | -128 | -87 | 26 | -41 | -67 | 44 |
| 2019 | -26 | -51 | -85 | -17 | -38 | -19 | -92 | -17 | -75 | -45 | -68 | -44 |
| 2020 | -92 | -17 | 26 | 0 | -117 | -40 | -66 | -2 | -13 | 1 | -126 | -79 |
| 2021 | 8 | -85 | -101 | -32 | -42 | -52 | -69 | -41 | -50 | -58 | -115 | -18 |
| 2022 | -93 | -45 | -153 | -81 | -98 | -112 | -115 | -61 | -9 | -62 | -66 | -73 |
| 2023 | -143 | -31 | -7 | -49 | -29 | -37 | -39 | -104 | -49 | -70 | -72 | -20 |
| 2024 | -30 | |||||||||||
| - = No Data Reported; -- = Not Applicable; NA = Not Available; W = Withheld to avoid disclosure of individual company data. |
| Release Date: 3/29/2024 |
| Next Release Date: 4/30/2024 |