|
Download Data (XLS File) |
|
||||||||
|
||||||||
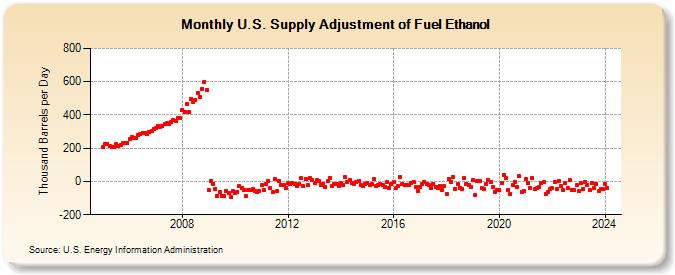
| U.S. Supply Adjustment of Fuel Ethanol (Thousand Barrels per Day) | ||||||||
| Year | Jan | Feb | Mar | Apr | May | Jun | Jul | Aug | Sep | Oct | Nov | Dec |
|---|---|---|---|---|---|---|---|---|---|---|---|---|
| 2005 | 206 | 225 | 226 | 216 | 209 | 206 | 225 | 213 | 221 | 230 | 233 | 234 |
| 2006 | 255 | 268 | 259 | 259 | 278 | 283 | 291 | 290 | 284 | 300 | 302 | 316 |
| 2007 | 319 | 336 | 329 | 332 | 343 | 349 | 343 | 359 | 372 | 362 | 382 | 379 |
| 2008 | 429 | 415 | 465 | 417 | 494 | 476 | 491 | 532 | 509 | 557 | 600 | 551 |
| 2009 | -51 | 4 | -16 | -46 | -86 | -62 | -85 | -87 | -57 | -72 | -95 | -59 |
| 2010 | -68 | -61 | -28 | -40 | -54 | -88 | -50 | -52 | -48 | -56 | -64 | -59 |
| 2011 | -24 | -54 | -18 | 5 | -42 | -66 | 14 | -59 | 3 | -20 | -23 | -39 |
| 2012 | -12 | -16 | -9 | -16 | -26 | -14 | 19 | -30 | 13 | -20 | 20 | 7 |
| 2013 | -8 | 8 | 3 | -19 | -13 | -34 | 1 | 20 | -30 | -16 | -18 | -29 |
| 2014 | -12 | -22 | 26 | -1 | 7 | -8 | -13 | -6 | 1 | -24 | -29 | -17 |
| 2015 | -7 | -21 | -16 | 13 | -27 | -22 | -13 | -21 | -33 | -4 | -41 | -14 |
| 2016 | -4 | -40 | -30 | 24 | -14 | -21 | -20 | -23 | -12 | -3 | -32 | -56 |
| 2017 | -32 | -17 | -3 | -17 | -21 | -38 | -14 | -33 | -39 | -28 | -53 | -27 |
| 2018 | -74 | 16 | -1 | 25 | -46 | -17 | -37 | -45 | 21 | -13 | -21 | -36 |
| 2019 | 7 | -79 | 1 | 2 | -40 | -48 | -14 | 9 | -4 | -33 | -63 | -49 |
| 2020 | -51 | -7 | 40 | 21 | -51 | -75 | -21 | -1 | -35 | 31 | -64 | -58 |
| 2021 | 12 | -8 | -37 | 20 | -47 | -42 | -36 | -9 | -6 | -73 | -62 | -47 |
| 2022 | -42 | -1 | -43 | 2 | -26 | -53 | -12 | -42 | 7 | -49 | -51 | -23 |
| 2023 | -53 | 0 | -48 | -3 | -16 | -51 | -12 | -41 | -10 | -61 | -47 | -48 |
| 2024 | -16 | -42 | -25 | 43 | -65 | -8 | ||||||
| - = No Data Reported; -- = Not Applicable; NA = Not Available; W = Withheld to avoid disclosure of individual company data. |
| Release Date: 8/30/2024 |
| Next Release Date: 9/30/2024 |
Referring Pages: