|
Download Data (XLS File) |
|
||||||||
|
||||||||
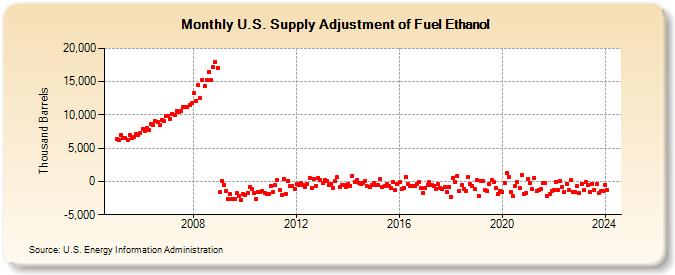
| U.S. Supply Adjustment of Fuel Ethanol (Thousand Barrels) | ||||||||
| Year | Jan | Feb | Mar | Apr | May | Jun | Jul | Aug | Sep | Oct | Nov | Dec |
|---|---|---|---|---|---|---|---|---|---|---|---|---|
| 2005 | 6,379 | 6,302 | 7,020 | 6,493 | 6,486 | 6,171 | 6,975 | 6,602 | 6,621 | 7,130 | 6,978 | 7,258 |
| 2006 | 7,897 | 7,512 | 8,031 | 7,761 | 8,625 | 8,500 | 9,023 | 8,993 | 8,505 | 9,289 | 9,046 | 9,805 |
| 2007 | 9,900 | 9,407 | 10,194 | 9,972 | 10,639 | 10,469 | 10,642 | 11,119 | 11,150 | 11,213 | 11,464 | 11,752 |
| 2008 | 13,294 | 12,035 | 14,426 | 12,509 | 15,320 | 14,274 | 15,214 | 16,490 | 15,260 | 17,267 | 18,006 | 17,070 |
| 2009 | -1,588 | 114 | -486 | -1,377 | -2,672 | -1,870 | -2,636 | -2,704 | -1,721 | -2,224 | -2,839 | -1,818 |
| 2010 | -2,103 | -1,709 | -883 | -1,208 | -1,666 | -2,655 | -1,538 | -1,603 | -1,431 | -1,735 | -1,912 | -1,827 |
| 2011 | -738 | -1,512 | -566 | 162 | -1,288 | -1,974 | 439 | -1,828 | 101 | -631 | -688 | -1,195 |
| 2012 | -374 | -472 | -276 | -472 | -791 | -405 | 582 | -931 | 388 | -616 | 586 | 225 |
| 2013 | -259 | 215 | 89 | -570 | -392 | -1,019 | 43 | 630 | -893 | -494 | -543 | -896 |
| 2014 | -382 | -630 | 820 | -35 | 232 | -250 | -418 | -179 | 44 | -729 | -878 | -520 |
| 2015 | -206 | -579 | -496 | 388 | -842 | -646 | -400 | -666 | -992 | -111 | -1,223 | -434 |
| 2016 | -131 | -1,171 | -934 | 714 | -423 | -621 | -612 | -699 | -351 | -106 | -969 | -1,745 |
| 2017 | -1,002 | -486 | -101 | -520 | -642 | -1,134 | -449 | -1,028 | -1,173 | -881 | -1,595 | -848 |
| 2018 | -2,294 | 453 | -26 | 754 | -1,429 | -523 | -1,147 | -1,405 | 629 | -401 | -626 | -1,121 |
| 2019 | 213 | -2,212 | 28 | 50 | -1,242 | -1,449 | -440 | 277 | -108 | -1,029 | -1,880 | -1,508 |
| 2020 | -1,595 | -204 | 1,229 | 643 | -1,587 | -2,241 | -636 | -44 | -1,039 | 960 | -1,908 | -1,797 |
| 2021 | 364 | -223 | -1,140 | 586 | -1,446 | -1,247 | -1,123 | -286 | -171 | -2,250 | -1,872 | -1,454 |
| 2022 | -1,312 | -16 | -1,333 | 64 | -793 | -1,585 | -358 | -1,297 | 224 | -1,514 | -1,524 | -726 |
| 2023 | -1,797 | -318 | -1,322 | -92 | -597 | -1,525 | -332 | -1,272 | -435 | -1,787 | -1,440 | -1,472 |
| 2024 | -494 | |||||||||||
| - = No Data Reported; -- = Not Applicable; NA = Not Available; W = Withheld to avoid disclosure of individual company data. |
| Release Date: 3/29/2024 |
| Next Release Date: 4/30/2024 |
Referring Pages: