|
Download Data (XLS File) |
|
||||||||
|
||||||||
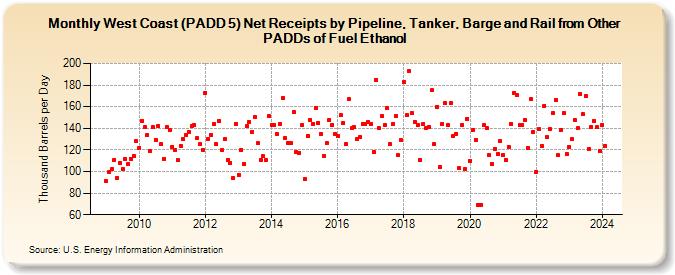
| West Coast (PADD 5) Net Receipts by Pipeline, Tanker, Barge and Rail from Other PADDs of Fuel Ethanol (Thousand Barrels per Day) | ||||||||
| Year | Jan | Feb | Mar | Apr | May | Jun | Jul | Aug | Sep | Oct | Nov | Dec |
|---|---|---|---|---|---|---|---|---|---|---|---|---|
| 2009 | 91 | 100 | 102 | 111 | 94 | 108 | 102 | 112 | 107 | 112 | 114 | 128 |
| 2010 | 122 | 147 | 141 | 134 | 119 | 141 | 129 | 142 | 125 | 112 | 141 | 138 |
| 2011 | 123 | 120 | 111 | 124 | 130 | 134 | 137 | 142 | 143 | 131 | 125 | 120 |
| 2012 | 173 | 130 | 134 | 144 | 125 | 147 | 120 | 130 | 111 | 108 | 94 | 144 |
| 2013 | 97 | 120 | 107 | 142 | 146 | 137 | 150 | 126 | 111 | 114 | 111 | 151 |
| 2014 | 143 | 143 | 135 | 144 | 168 | 131 | 126 | 126 | 155 | 118 | 117 | 143 |
| 2015 | 93 | 133 | 148 | 144 | 159 | 145 | 135 | 114 | 126 | 148 | 143 | 135 |
| 2016 | 133 | 152 | 145 | 125 | 167 | 140 | 141 | 130 | 132 | 144 | 144 | 146 |
| 2017 | 144 | 118 | 185 | 140 | 151 | 143 | 159 | 125 | 144 | 151 | 115 | 129 |
| 2018 | 183 | 152 | 193 | 154 | 146 | 143 | 111 | 144 | 140 | 141 | 175 | 125 |
| 2019 | 160 | 104 | 144 | 163 | 143 | 163 | 133 | 135 | 103 | 143 | 102 | 149 |
| 2020 | 110 | 138 | 129 | 69 | 69 | 143 | 140 | 115 | 107 | 121 | 116 | 128 |
| 2021 | 115 | 111 | 123 | 144 | 173 | 171 | 143 | 143 | 148 | 122 | 167 | 137 |
| 2022 | 100 | 139 | 124 | 161 | 132 | 139 | 154 | 166 | 115 | 138 | 154 | 116 |
| 2023 | 123 | 130 | 148 | 140 | 172 | 153 | 170 | 121 | 141 | 147 | 141 | 119 |
| 2024 | 143 | 124 | 136 | 168 | 136 | 148 | ||||||
| - = No Data Reported; -- = Not Applicable; NA = Not Available; W = Withheld to avoid disclosure of individual company data. |
| Release Date: 8/30/2024 |
| Next Release Date: 9/30/2024 |