|
Download Data (XLS File) |
|
||||||||
|
||||||||
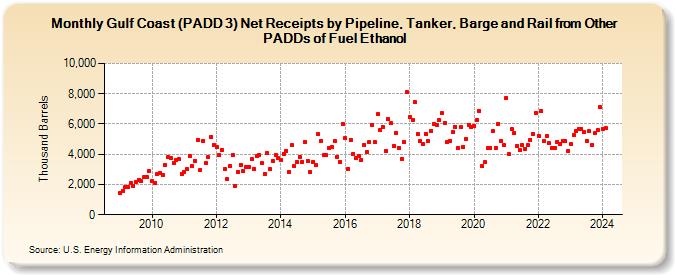
| Gulf Coast (PADD 3) Net Receipts by Pipeline, Tanker, Barge and Rail from Other PADDs of Fuel Ethanol (Thousand Barrels) | ||||||||
| Year | Jan | Feb | Mar | Apr | May | Jun | Jul | Aug | Sep | Oct | Nov | Dec |
|---|---|---|---|---|---|---|---|---|---|---|---|---|
| 2009 | 1,410 | 1,578 | 1,812 | 1,846 | 2,093 | 1,917 | 2,192 | 2,316 | 2,197 | 2,476 | 2,471 | 2,869 |
| 2010 | 2,204 | 2,110 | 2,714 | 2,733 | 2,633 | 3,286 | 3,790 | 3,729 | 3,452 | 3,624 | 3,664 | 2,697 |
| 2011 | 2,793 | 2,994 | 3,884 | 3,229 | 3,569 | 4,967 | 2,962 | 4,904 | 3,404 | 3,793 | 5,167 | 4,607 |
| 2012 | 4,478 | 3,928 | 4,306 | 3,015 | 2,352 | 3,207 | 3,948 | 1,903 | 2,848 | 3,314 | 2,888 | 3,186 |
| 2013 | 3,164 | 3,711 | 3,049 | 3,897 | 3,958 | 3,418 | 2,719 | 4,057 | 3,016 | 3,560 | 3,924 | 3,740 |
| 2014 | 3,634 | 4,037 | 4,246 | 2,853 | 4,593 | 3,216 | 3,478 | 3,846 | 3,500 | 4,829 | 3,571 | 2,813 |
| 2015 | 3,498 | 3,320 | 5,327 | 4,903 | 3,919 | 3,921 | 4,404 | 4,505 | 4,852 | 3,842 | 3,504 | 5,975 |
| 2016 | 5,045 | 3,052 | 4,941 | 4,032 | 3,723 | 3,882 | 3,645 | 4,638 | 4,156 | 4,817 | 5,933 | 4,781 |
| 2017 | 6,638 | 5,598 | 5,779 | 4,215 | 6,327 | 6,036 | 4,538 | 5,412 | 4,411 | 3,709 | 4,807 | 8,094 |
| 2018 | 6,474 | 6,281 | 7,448 | 5,324 | 4,859 | 4,688 | 5,355 | 4,848 | 5,554 | 6,012 | 5,902 | 6,249 |
| 2019 | 6,693 | 6,078 | 4,788 | 4,902 | 5,440 | 5,832 | 4,439 | 5,799 | 4,478 | 5,030 | 5,952 | 5,797 |
| 2020 | 5,894 | 6,269 | 6,863 | 3,191 | 3,461 | 4,392 | 4,418 | 5,531 | 4,420 | 6,017 | 4,899 | 4,578 |
| 2021 | 7,721 | 3,991 | 5,646 | 5,379 | 4,558 | 4,263 | 4,583 | 4,371 | 4,625 | 4,959 | 5,332 | 6,745 |
| 2022 | 5,217 | 6,888 | 4,856 | 5,228 | 4,727 | 4,401 | 4,426 | 4,836 | 4,699 | 4,907 | 4,864 | 4,209 |
| 2023 | 4,643 | 5,283 | 5,513 | 5,650 | 5,668 | 5,454 | 4,879 | 5,510 | 4,640 | 5,372 | 5,569 | 7,092 |
| 2024 | 5,653 | |||||||||||
| - = No Data Reported; -- = Not Applicable; NA = Not Available; W = Withheld to avoid disclosure of individual company data. |
| Release Date: 3/29/2024 |
| Next Release Date: 4/30/2024 |