|
Download Data (XLS File) |
|
||||||||
|
||||||||
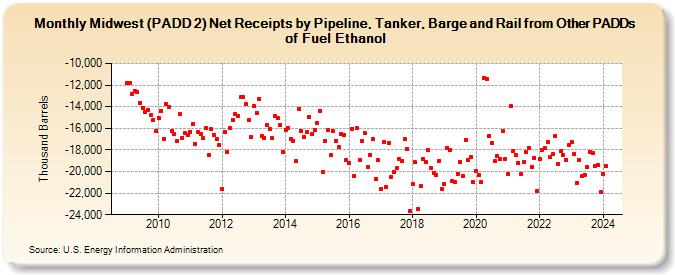
| Midwest (PADD 2) Net Receipts by Pipeline, Tanker, Barge and Rail from Other PADDs of Fuel Ethanol (Thousand Barrels) | ||||||||
| Year | Jan | Feb | Mar | Apr | May | Jun | Jul | Aug | Sep | Oct | Nov | Dec |
|---|---|---|---|---|---|---|---|---|---|---|---|---|
| 2009 | -11,835 | -11,824 | -12,799 | -12,567 | -12,640 | -13,627 | -14,149 | -14,525 | -14,313 | -14,794 | -15,207 | -16,287 |
| 2010 | -15,049 | -14,368 | -16,951 | -13,755 | -14,008 | -16,289 | -16,498 | -17,171 | -14,702 | -16,872 | -16,462 | -16,641 |
| 2011 | -16,297 | -15,627 | -17,424 | -16,334 | -16,497 | -16,940 | -16,004 | -18,517 | -16,043 | -16,632 | -16,960 | -17,586 |
| 2012 | -21,613 | -16,297 | -18,227 | -15,977 | -15,197 | -14,648 | -14,877 | -13,118 | -13,149 | -13,779 | -15,258 | -16,839 |
| 2013 | -13,961 | -14,556 | -13,282 | -16,722 | -16,874 | -15,686 | -16,045 | -16,912 | -14,866 | -15,024 | -15,673 | -18,232 |
| 2014 | -16,116 | -15,991 | -16,958 | -17,141 | -19,073 | -14,251 | -16,218 | -16,795 | -16,316 | -14,972 | -16,505 | -16,118 |
| 2015 | -15,485 | -14,418 | -20,040 | -17,166 | -16,203 | -18,469 | -16,293 | -17,186 | -17,745 | -16,494 | -16,590 | -18,946 |
| 2016 | -19,236 | -16,019 | -20,414 | -16,011 | -18,916 | -17,200 | -16,471 | -19,556 | -18,451 | -16,988 | -20,740 | -18,977 |
| 2017 | -21,624 | -17,297 | -21,430 | -17,387 | -20,483 | -20,052 | -19,713 | -18,821 | -18,995 | -16,994 | -17,940 | -23,685 |
| 2018 | -21,190 | -19,166 | -23,427 | -21,330 | -18,809 | -19,076 | -17,967 | -19,657 | -20,132 | -20,359 | -19,008 | -21,625 |
| 2019 | -21,124 | -17,810 | -17,991 | -20,917 | -20,951 | -20,225 | -19,156 | -20,374 | -17,051 | -18,925 | -18,702 | -21,015 |
| 2020 | -19,940 | -20,357 | -20,987 | -11,300 | -11,393 | -16,690 | -17,370 | -19,034 | -18,548 | -18,820 | -16,210 | -18,859 |
| 2021 | -20,268 | -13,970 | -18,098 | -18,476 | -19,205 | -20,225 | -19,136 | -18,229 | -17,846 | -19,609 | -18,740 | -21,793 |
| 2022 | -18,833 | -17,982 | -17,852 | -17,291 | -18,654 | -18,402 | -16,750 | -19,275 | -18,109 | -18,429 | -18,905 | -17,503 |
| 2023 | -17,245 | -18,363 | -21,035 | -18,911 | -20,427 | -20,313 | -19,571 | -18,201 | -18,249 | -19,536 | -19,389 | -22,160 |
| 2024 | -20,591 | -19,957 | -20,598 | -19,227 | -20,058 | -18,826 | ||||||
| - = No Data Reported; -- = Not Applicable; NA = Not Available; W = Withheld to avoid disclosure of individual company data. |
| Release Date: 8/30/2024 |
| Next Release Date: 9/30/2024 |