|
Download Data (XLS File) |
|
||||||||
|
||||||||
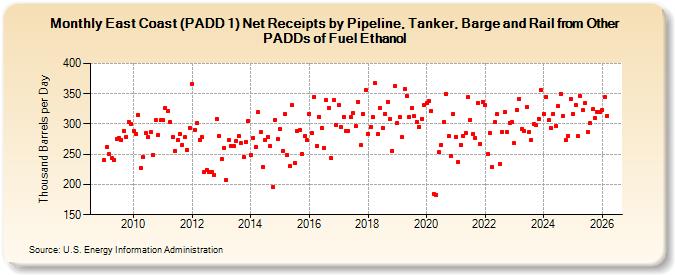
| East Coast (PADD 1) Net Receipts by Pipeline, Tanker, Barge and Rail from Other PADDs of Fuel Ethanol (Thousand Barrels per Day) | ||||||||
| Year | Jan | Feb | Mar | Apr | May | Jun | Jul | Aug | Sep | Oct | Nov | Dec |
|---|---|---|---|---|---|---|---|---|---|---|---|---|
| 2009 | 240 | 262 | 250 | 243 | 241 | 275 | 277 | 274 | 289 | 279 | 304 | 300 |
| 2010 | 288 | 284 | 315 | 228 | 245 | 285 | 278 | 286 | 249 | 306 | 281 | 306 |
| 2011 | 306 | 326 | 322 | 303 | 278 | 255 | 273 | 284 | 266 | 278 | 257 | 293 |
| 2012 | 366 | 290 | 301 | 274 | 278 | 220 | 224 | 220 | 220 | 216 | 309 | 280 |
| 2013 | 242 | 260 | 208 | 273 | 263 | 264 | 272 | 280 | 268 | 245 | 271 | 305 |
| 2014 | 248 | 277 | 262 | 319 | 286 | 229 | 273 | 279 | 264 | 196 | 307 | 275 |
| 2015 | 291 | 255 | 316 | 249 | 230 | 331 | 236 | 289 | 290 | 251 | 280 | 273 |
| 2016 | 317 | 285 | 345 | 264 | 312 | 294 | 260 | 339 | 327 | 243 | 339 | 299 |
| 2017 | 331 | 295 | 312 | 289 | 289 | 311 | 318 | 296 | 337 | 265 | 317 | 356 |
| 2018 | 284 | 295 | 311 | 367 | 283 | 327 | 293 | 317 | 337 | 308 | 256 | 362 |
| 2019 | 302 | 311 | 278 | 358 | 346 | 312 | 327 | 313 | 304 | 295 | 309 | 331 |
| 2020 | 335 | 338 | 322 | 185 | 183 | 253 | 266 | 304 | 350 | 280 | 247 | 317 |
| 2021 | 279 | 237 | 266 | 280 | 285 | 344 | 307 | 284 | 277 | 335 | 267 | 337 |
| 2022 | 331 | 250 | 285 | 229 | 303 | 316 | 234 | 287 | 320 | 286 | 302 | 303 |
| 2023 | 268 | 323 | 342 | 292 | 289 | 328 | 286 | 274 | 300 | 298 | 308 | 346 |
| 2024 | 326 | |||||||||||
| - = No Data Reported; -- = Not Applicable; NA = Not Available; W = Withheld to avoid disclosure of individual company data. |
| Release Date: 3/29/2024 |
| Next Release Date: 4/30/2024 |