|
Download Data (XLS File) |
|
||||||||
|
||||||||
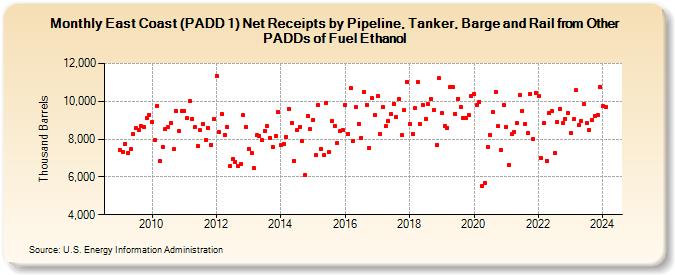
| East Coast (PADD 1) Net Receipts by Pipeline, Tanker, Barge and Rail from Other PADDs of Fuel Ethanol (Thousand Barrels) | ||||||||
| Year | Jan | Feb | Mar | Apr | May | Jun | Jul | Aug | Sep | Oct | Nov | Dec |
|---|---|---|---|---|---|---|---|---|---|---|---|---|
| 2009 | 7,447 | 7,334 | 7,765 | 7,280 | 7,470 | 8,265 | 8,576 | 8,505 | 8,671 | 8,648 | 9,123 | 9,298 |
| 2010 | 8,929 | 7,948 | 9,770 | 6,828 | 7,606 | 8,539 | 8,624 | 8,862 | 7,460 | 9,485 | 8,426 | 9,497 |
| 2011 | 9,473 | 9,115 | 9,996 | 9,078 | 8,624 | 7,649 | 8,460 | 8,816 | 7,973 | 8,605 | 7,711 | 9,088 |
| 2012 | 11,335 | 8,401 | 9,324 | 8,220 | 8,622 | 6,602 | 6,937 | 6,808 | 6,588 | 6,693 | 9,258 | 8,665 |
| 2013 | 7,496 | 7,279 | 6,452 | 8,191 | 8,159 | 7,934 | 8,442 | 8,675 | 8,055 | 7,580 | 8,138 | 9,456 |
| 2014 | 7,681 | 7,763 | 8,137 | 9,578 | 8,873 | 6,856 | 8,470 | 8,654 | 7,911 | 6,084 | 9,221 | 8,520 |
| 2015 | 9,024 | 7,142 | 9,802 | 7,479 | 7,140 | 9,926 | 7,324 | 8,947 | 8,699 | 7,771 | 8,405 | 8,467 |
| 2016 | 9,830 | 8,264 | 10,691 | 7,920 | 9,672 | 8,813 | 8,072 | 10,511 | 9,815 | 7,541 | 10,158 | 9,263 |
| 2017 | 10,271 | 8,267 | 9,676 | 8,673 | 8,972 | 9,316 | 9,872 | 9,166 | 10,122 | 8,209 | 9,516 | 11,029 |
| 2018 | 8,795 | 8,263 | 9,646 | 11,021 | 8,779 | 9,805 | 9,082 | 9,834 | 10,104 | 9,558 | 7,693 | 11,217 |
| 2019 | 9,366 | 8,703 | 8,604 | 10,736 | 10,736 | 9,348 | 10,146 | 9,705 | 9,113 | 9,135 | 9,278 | 10,259 |
| 2020 | 10,391 | 9,799 | 9,981 | 5,543 | 5,686 | 7,599 | 8,235 | 9,430 | 10,514 | 8,668 | 7,424 | 9,828 |
| 2021 | 8,646 | 6,626 | 8,245 | 8,388 | 8,843 | 10,309 | 9,506 | 8,800 | 8,299 | 10,399 | 8,017 | 10,459 |
| 2022 | 10,261 | 6,998 | 8,835 | 6,862 | 9,383 | 9,470 | 7,240 | 8,906 | 9,596 | 8,851 | 9,064 | 9,378 |
| 2023 | 8,312 | 9,040 | 10,587 | 8,758 | 8,956 | 9,831 | 8,861 | 8,506 | 9,007 | 9,246 | 9,269 | 11,028 |
| 2024 | 9,828 | 10,018 | 9,273 | 8,610 | 9,309 | 9,005 | ||||||
| - = No Data Reported; -- = Not Applicable; NA = Not Available; W = Withheld to avoid disclosure of individual company data. |
| Release Date: 8/30/2024 |
| Next Release Date: 9/30/2024 |