|
Download Data (XLS File) |
|
||||||||
|
||||||||
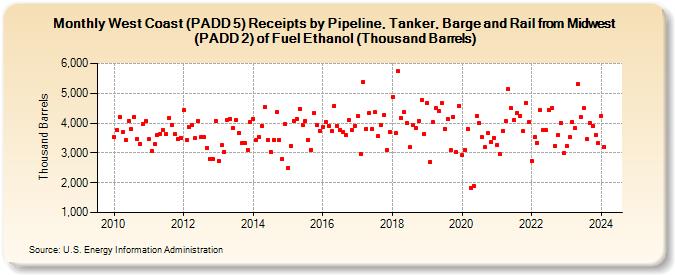
| West Coast (PADD 5) Receipts by Pipeline, Tanker, Barge and Rail from Midwest (PADD 2) of Fuel Ethanol (Thousand Barrels) (Thousand Barrels) | ||||||||
| Year | Jan | Feb | Mar | Apr | May | Jun | Jul | Aug | Sep | Oct | Nov | Dec |
|---|---|---|---|---|---|---|---|---|---|---|---|---|
| 2010 | 3,533 | 3,758 | 4,205 | 3,686 | 3,446 | 4,077 | 3,801 | 4,214 | 3,475 | 3,310 | 3,982 | 4,069 |
| 2011 | 3,454 | 3,050 | 3,283 | 3,607 | 3,647 | 3,767 | 3,620 | 4,174 | 3,927 | 3,629 | 3,475 | 3,514 |
| 2012 | 4,428 | 3,432 | 3,880 | 3,935 | 3,497 | 4,071 | 3,530 | 3,525 | 3,179 | 2,811 | 2,787 | 4,083 |
| 2013 | 2,731 | 3,250 | 3,034 | 4,106 | 4,149 | 3,841 | 4,101 | 3,660 | 3,328 | 3,338 | 3,103 | 4,021 |
| 2014 | 4,152 | 3,441 | 3,531 | 3,911 | 4,534 | 3,439 | 3,046 | 3,428 | 4,362 | 3,433 | 2,797 | 3,970 |
| 2015 | 2,495 | 3,239 | 4,074 | 4,154 | 4,483 | 3,951 | 4,086 | 3,433 | 3,104 | 4,340 | 3,924 | 3,740 |
| 2016 | 3,875 | 4,049 | 3,919 | 3,739 | 4,587 | 3,907 | 3,774 | 3,708 | 3,589 | 4,089 | 3,771 | 3,918 |
| 2017 | 4,239 | 2,971 | 5,382 | 3,812 | 4,347 | 3,818 | 4,360 | 3,562 | 3,945 | 4,267 | 3,084 | 3,703 |
| 2018 | 4,872 | 3,658 | 5,738 | 4,172 | 4,370 | 3,993 | 3,183 | 3,948 | 3,832 | 4,070 | 4,778 | 3,639 |
| 2019 | 4,676 | 2,712 | 4,027 | 4,505 | 4,392 | 4,670 | 3,806 | 4,134 | 3,082 | 4,216 | 3,019 | 4,584 |
| 2020 | 2,918 | 3,112 | 3,819 | 1,828 | 1,902 | 4,248 | 3,997 | 3,520 | 3,186 | 3,664 | 3,363 | 3,516 |
| 2021 | 3,267 | 2,953 | 3,735 | 4,061 | 5,135 | 4,497 | 4,113 | 4,341 | 4,247 | 3,721 | 4,688 | 4,029 |
| 2022 | 2,738 | 3,540 | 3,348 | 4,427 | 3,758 | 3,758 | 4,439 | 4,503 | 3,232 | 3,594 | 4,017 | 2,982 |
| 2023 | 3,226 | 3,533 | 4,033 | 3,821 | 5,305 | 4,195 | 4,498 | 3,464 | 4,008 | 3,896 | 3,603 | 3,327 |
| 2024 | 4,218 | |||||||||||
| - = No Data Reported; -- = Not Applicable; NA = Not Available; W = Withheld to avoid disclosure of individual company data. |
| Release Date: 3/29/2024 |
| Next Release Date: 4/30/2024 |