|
Download Data (XLS File) |
|
||||||||
|
||||||||
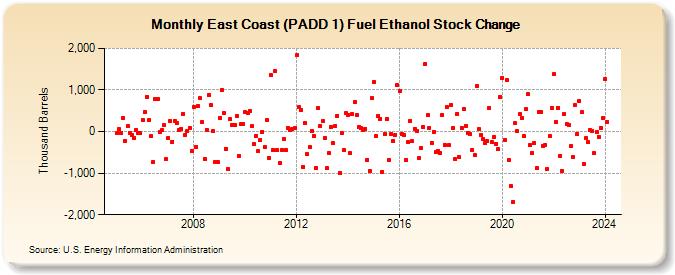
| East Coast (PADD 1) Fuel Ethanol Stock Change (Thousand Barrels) | ||||||||
| Year | Jan | Feb | Mar | Apr | May | Jun | Jul | Aug | Sep | Oct | Nov | Dec |
|---|---|---|---|---|---|---|---|---|---|---|---|---|
| 2005 | -44 | 57 | -26 | 325 | -227 | 130 | -30 | -78 | -144 | 44 | -24 | -32 |
| 2006 | 283 | 478 | 836 | 267 | -110 | -736 | 793 | 775 | -11 | 31 | 148 | -671 |
| 2007 | -156 | 251 | -240 | 261 | 202 | 43 | 72 | 432 | -82 | 23 | 88 | -472 |
| 2008 | 593 | -363 | 615 | 795 | 229 | -656 | 45 | 882 | 639 | 10 | -721 | -739 |
| 2009 | 333 | 1,008 | 457 | -409 | -902 | 294 | 169 | 162 | 385 | -584 | 172 | 176 |
| 2010 | 463 | 446 | 492 | 127 | -303 | -99 | -470 | -200 | -3 | -366 | 288 | -641 |
| 2011 | 1,353 | -444 | 1,450 | -451 | -760 | -436 | -169 | -452 | 93 | 48 | 58 | 81 |
| 2012 | 1,831 | 585 | 530 | -844 | 199 | -546 | -373 | 18 | -98 | -871 | 564 | 140 |
| 2013 | 248 | -145 | -888 | -514 | 118 | -282 | 142 | 383 | -994 | -40 | -449 | 436 |
| 2014 | 407 | -527 | 418 | 704 | 393 | 104 | 74 | 26 | 69 | -676 | -950 | 797 |
| 2015 | 1,202 | -117 | 384 | 308 | -965 | -64 | 307 | -690 | -49 | -223 | -72 | 1,111 |
| 2016 | 978 | -58 | -82 | -675 | -253 | 261 | -236 | 72 | 11 | -644 | -401 | 106 |
| 2017 | 1,627 | 397 | 90 | -273 | -2 | -487 | -464 | -510 | 404 | -317 | 583 | -331 |
| 2018 | 641 | 96 | -668 | 427 | -624 | 93 | 549 | 144 | -26 | -57 | -439 | -569 |
| 2019 | 1,086 | 50 | -79 | -177 | -275 | -230 | 563 | -255 | -120 | -293 | -428 | 840 |
| 2020 | 1,294 | -205 | 1,239 | -675 | -1,315 | -1,694 | 196 | 4 | 422 | 328 | -118 | 533 |
| 2021 | 894 | -321 | -511 | -272 | -882 | 463 | 476 | -345 | -314 | -895 | -113 | 575 |
| 2022 | 1,374 | 237 | 573 | -579 | -947 | 411 | 177 | 161 | -358 | -609 | 635 | -69 |
| 2023 | 737 | 458 | -754 | -161 | -277 | 43 | 21 | -532 | -1 | -117 | 91 | 322 |
| 2024 | 1,259 | 230 | -136 | -70 | -955 | -640 | ||||||
| - = No Data Reported; -- = Not Applicable; NA = Not Available; W = Withheld to avoid disclosure of individual company data. |
| Release Date: 8/30/2024 |
| Next Release Date: 9/30/2024 |