|
Download Data (XLS File) |
|
||||||||
|
||||||||
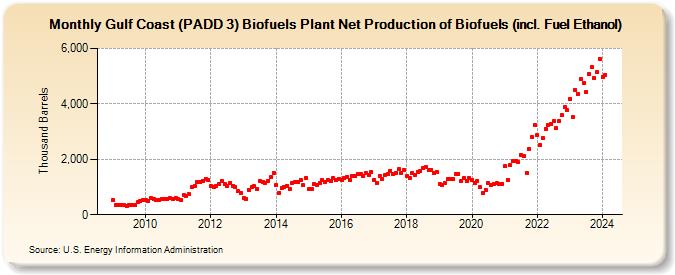
| Gulf Coast (PADD 3) Biofuels Plant Net Production of Biofuels (incl. Fuel Ethanol) (Thousand Barrels) | ||||||||
| Year | Jan | Feb | Mar | Apr | May | Jun | Jul | Aug | Sep | Oct | Nov | Dec |
|---|---|---|---|---|---|---|---|---|---|---|---|---|
| 2009 | 522 | 333 | 337 | 347 | 367 | 316 | 367 | 349 | 338 | 442 | 495 | 528 |
| 2010 | 517 | 500 | 597 | 551 | 531 | 525 | 571 | 563 | 561 | 587 | 567 | 618 |
| 2011 | 568 | 515 | 696 | 690 | 730 | 984 | 1,051 | 1,167 | 1,165 | 1,228 | 1,303 | 1,269 |
| 2012 | 1,039 | 1,015 | 1,038 | 1,108 | 1,219 | 1,123 | 1,044 | 1,155 | 1,046 | 990 | 847 | 778 |
| 2013 | 609 | 573 | 903 | 994 | 1,022 | 937 | 1,229 | 1,176 | 1,157 | 1,231 | 1,355 | 1,511 |
| 2014 | 1,056 | 797 | 946 | 1,012 | 1,042 | 918 | 1,158 | 1,172 | 1,164 | 1,263 | 1,055 | 1,334 |
| 2015 | 913 | 911 | 1,099 | 1,078 | 1,153 | 1,242 | 1,196 | 1,242 | 1,223 | 1,324 | 1,244 | 1,306 |
| 2016 | 1,243 | 1,320 | 1,368 | 1,257 | 1,396 | 1,393 | 1,456 | 1,453 | 1,380 | 1,489 | 1,434 | 1,525 |
| 2017 | 1,254 | 1,134 | 1,403 | 1,297 | 1,417 | 1,455 | 1,589 | 1,465 | 1,519 | 1,632 | 1,515 | 1,617 |
| 2018 | 1,405 | 1,307 | 1,509 | 1,448 | 1,558 | 1,562 | 1,681 | 1,713 | 1,611 | 1,626 | 1,514 | 1,530 |
| 2019 | 1,097 | 1,072 | 1,128 | 1,272 | 1,304 | 1,291 | 1,472 | 1,477 | 1,231 | 1,321 | 1,200 | 1,323 |
| 2020 | 1,235 | 1,133 | 1,234 | 996 | 798 | 903 | 1,144 | 1,086 | 1,118 | 1,127 | 1,102 | 1,120 |
| 2021 | 1,743 | 1,265 | 1,788 | 1,928 | 1,921 | 1,886 | 2,162 | 2,107 | 1,497 | 2,377 | 2,806 | 3,225 |
| 2022 | 2,859 | 2,520 | 2,765 | 3,099 | 3,230 | 3,271 | 3,374 | 3,112 | 3,373 | 3,590 | 3,868 | 3,763 |
| 2023 | 4,183 | 3,510 | 4,498 | 4,372 | 4,905 | 4,751 | 4,433 | 5,084 | 5,312 | 4,939 | 5,134 | 5,631 |
| 2024 | 4,978 | |||||||||||
| - = No Data Reported; -- = Not Applicable; NA = Not Available; W = Withheld to avoid disclosure of individual company data. |
| Release Date: 3/29/2024 |
| Next Release Date: 4/30/2024 |