|
Download Data (XLS File) |
|
||||||||
|
||||||||
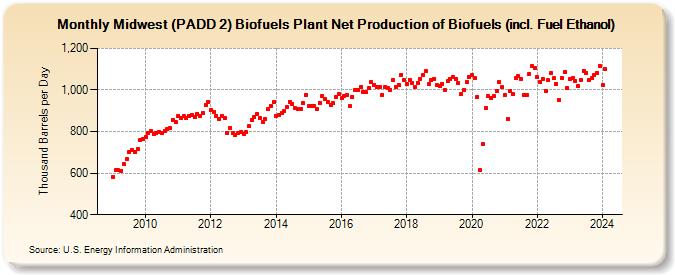
| Midwest (PADD 2) Biofuels Plant Net Production of Biofuels (incl. Fuel Ethanol) (Thousand Barrels per Day) | ||||||||
| Year | Jan | Feb | Mar | Apr | May | Jun | Jul | Aug | Sep | Oct | Nov | Dec |
|---|---|---|---|---|---|---|---|---|---|---|---|---|
| 2009 | 583 | 613 | 613 | 612 | 643 | 669 | 703 | 709 | 703 | 715 | 760 | 765 |
| 2010 | 774 | 794 | 801 | 789 | 791 | 798 | 794 | 804 | 811 | 817 | 857 | 847 |
| 2011 | 875 | 866 | 874 | 863 | 873 | 880 | 872 | 886 | 873 | 889 | 926 | 944 |
| 2012 | 906 | 895 | 873 | 858 | 876 | 864 | 795 | 819 | 792 | 783 | 795 | 799 |
| 2013 | 788 | 797 | 825 | 856 | 871 | 886 | 863 | 845 | 858 | 908 | 924 | 940 |
| 2014 | 877 | 879 | 888 | 900 | 916 | 944 | 933 | 913 | 908 | 910 | 935 | 978 |
| 2015 | 922 | 925 | 922 | 908 | 939 | 972 | 956 | 942 | 927 | 938 | 965 | 980 |
| 2016 | 959 | 971 | 978 | 924 | 968 | 1,000 | 1,001 | 1,016 | 988 | 990 | 1,010 | 1,038 |
| 2017 | 1,023 | 1,015 | 1,016 | 976 | 1,014 | 1,011 | 1,001 | 1,047 | 1,014 | 1,023 | 1,074 | 1,048 |
| 2018 | 1,029 | 1,050 | 1,035 | 1,012 | 1,034 | 1,055 | 1,072 | 1,090 | 1,027 | 1,049 | 1,055 | 1,026 |
| 2019 | 1,020 | 1,029 | 1,000 | 1,041 | 1,054 | 1,062 | 1,054 | 1,033 | 980 | 1,000 | 1,038 | 1,064 |
| 2020 | 1,072 | 1,057 | 968 | 615 | 739 | 913 | 969 | 963 | 972 | 997 | 1,036 | 1,014 |
| 2021 | 977 | 862 | 994 | 979 | 1,058 | 1,065 | 1,055 | 978 | 975 | 1,079 | 1,113 | 1,106 |
| 2022 | 1,062 | 1,039 | 1,055 | 997 | 1,046 | 1,081 | 1,056 | 1,031 | 952 | 1,058 | 1,086 | 1,009 |
| 2023 | 1,050 | 1,053 | 1,038 | 1,016 | 1,042 | 1,089 | 1,084 | 1,050 | 1,051 | 1,074 | 1,084 | 1,114 |
| 2024 | 1,022 | 1,100 | 1,101 | 1,017 | 1,067 | 1,084 | ||||||
| - = No Data Reported; -- = Not Applicable; NA = Not Available; W = Withheld to avoid disclosure of individual company data. |
| Release Date: 8/30/2024 |
| Next Release Date: 9/30/2024 |