|
Download Data (XLS File) |
|
||||||||
|
||||||||
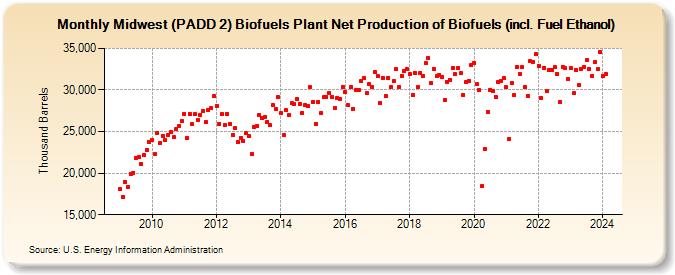
| Midwest (PADD 2) Biofuels Plant Net Production of Biofuels (incl. Fuel Ethanol) (Thousand Barrels) | ||||||||
| Year | Jan | Feb | Mar | Apr | May | Jun | Jul | Aug | Sep | Oct | Nov | Dec |
|---|---|---|---|---|---|---|---|---|---|---|---|---|
| 2009 | 18,084 | 17,172 | 18,990 | 18,350 | 19,920 | 20,074 | 21,801 | 21,967 | 21,079 | 22,176 | 22,788 | 23,717 |
| 2010 | 23,994 | 22,241 | 24,825 | 23,673 | 24,513 | 23,928 | 24,600 | 24,935 | 24,319 | 25,334 | 25,697 | 26,255 |
| 2011 | 27,117 | 24,249 | 27,082 | 25,892 | 27,061 | 26,403 | 27,033 | 27,455 | 26,191 | 27,570 | 27,781 | 29,250 |
| 2012 | 28,089 | 25,958 | 27,064 | 25,752 | 27,151 | 25,923 | 24,634 | 25,389 | 23,770 | 24,284 | 23,845 | 24,781 |
| 2013 | 24,433 | 22,325 | 25,589 | 25,675 | 26,987 | 26,578 | 26,749 | 26,204 | 25,729 | 28,139 | 27,706 | 29,126 |
| 2014 | 27,172 | 24,611 | 27,535 | 27,007 | 28,390 | 28,308 | 28,922 | 28,312 | 27,246 | 28,203 | 28,048 | 30,315 |
| 2015 | 28,591 | 25,897 | 28,579 | 27,242 | 29,115 | 29,171 | 29,630 | 29,212 | 27,819 | 29,087 | 28,962 | 30,388 |
| 2016 | 29,731 | 28,148 | 30,306 | 27,720 | 30,003 | 30,014 | 31,030 | 31,483 | 29,639 | 30,698 | 30,314 | 32,180 |
| 2017 | 31,702 | 28,417 | 31,484 | 29,275 | 31,441 | 30,328 | 31,042 | 32,462 | 30,412 | 31,700 | 32,229 | 32,474 |
| 2018 | 31,896 | 29,394 | 32,089 | 30,348 | 32,064 | 31,657 | 33,220 | 33,799 | 30,810 | 32,525 | 31,656 | 31,802 |
| 2019 | 31,606 | 28,798 | 31,009 | 31,241 | 32,663 | 31,863 | 32,677 | 32,008 | 29,407 | 30,985 | 31,138 | 32,991 |
| 2020 | 33,220 | 30,667 | 29,993 | 18,450 | 22,898 | 27,392 | 30,051 | 29,847 | 29,161 | 30,899 | 31,083 | 31,423 |
| 2021 | 30,301 | 24,139 | 30,827 | 29,367 | 32,784 | 31,957 | 32,709 | 30,321 | 29,251 | 33,437 | 33,405 | 34,285 |
| 2022 | 32,917 | 29,093 | 32,693 | 29,903 | 32,415 | 32,441 | 32,751 | 31,950 | 28,554 | 32,800 | 32,586 | 31,270 |
| 2023 | 32,651 | 29,597 | 32,372 | 30,567 | 32,493 | 32,774 | 33,606 | 32,564 | 31,713 | 33,305 | 32,520 | 34,526 |
| 2024 | 31,674 | |||||||||||
| - = No Data Reported; -- = Not Applicable; NA = Not Available; W = Withheld to avoid disclosure of individual company data. |
| Release Date: 3/29/2024 |
| Next Release Date: 4/30/2024 |