|
Download Data (XLS File) |
|
||||||||
|
||||||||
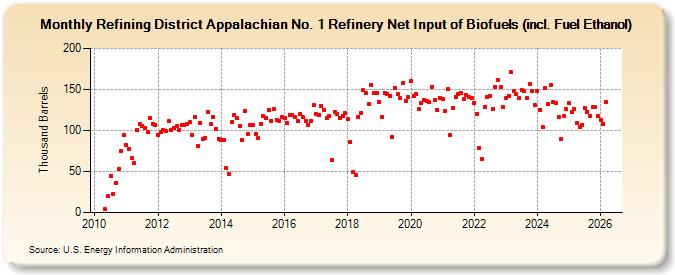
| Refining District Appalachian No. 1 Refinery Net Input of Biofuels (incl. Fuel Ethanol) (Thousand Barrels) | ||||||||
| Year | Jan | Feb | Mar | Apr | May | Jun | Jul | Aug | Sep | Oct | Nov | Dec |
|---|---|---|---|---|---|---|---|---|---|---|---|---|
| 2010 | 4 | 20 | 44 | 23 | 36 | 53 | 75 | 94 | ||||
| 2011 | 82 | 78 | 66 | 60 | 101 | 108 | 105 | 103 | 98 | 115 | 108 | 107 |
| 2012 | 94 | 98 | 100 | 99 | 111 | 100 | 103 | 105 | 100 | 107 | 107 | 108 |
| 2013 | 110 | 94 | 116 | 81 | 109 | 90 | 91 | 123 | 108 | 117 | 102 | 90 |
| 2014 | 89 | 88 | 54 | 47 | 110 | 119 | 115 | 105 | 88 | 124 | 96 | 107 |
| 2015 | 107 | 96 | 91 | 108 | 118 | 115 | 125 | 111 | 126 | 113 | 111 | 116 |
| 2016 | 115 | 109 | 119 | 119 | 116 | 112 | 120 | 116 | 112 | 107 | 112 | 131 |
| 2017 | 120 | 119 | 130 | 125 | 115 | 118 | 64 | 123 | 120 | 115 | 118 | 121 |
| 2018 | 114 | 86 | 49 | 46 | 117 | 121 | 149 | 146 | 132 | 156 | 146 | 146 |
| 2019 | 135 | 116 | 146 | 145 | 142 | 92 | 152 | 144 | 139 | 158 | 136 | 141 |
| 2020 | 160 | 142 | 144 | 126 | 133 | 137 | 136 | 135 | 153 | 137 | 125 | 140 |
| 2021 | 138 | 124 | 150 | 94 | 127 | 141 | 145 | 146 | 138 | 143 | 141 | 140 |
| 2022 | 134 | 120 | 79 | 65 | 129 | 141 | 142 | 126 | 153 | 161 | 153 | 128 |
| 2023 | 139 | 142 | 171 | 148 | 144 | 139 | 149 | 148 | 140 | 157 | 148 | 131 |
| 2024 | 148 | |||||||||||
| - = No Data Reported; -- = Not Applicable; NA = Not Available; W = Withheld to avoid disclosure of individual company data. |
| Release Date: 3/29/2024 |
| Next Release Date: 4/30/2024 |