|
Download Data (XLS File) |
|
||||||||
|
||||||||
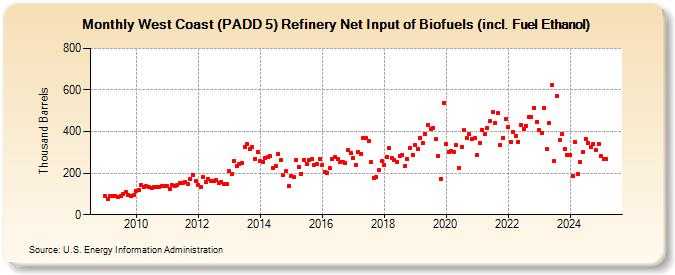
| West Coast (PADD 5) Refinery Net Input of Biofuels (incl. Fuel Ethanol) (Thousand Barrels) | ||||||||
| Year | Jan | Feb | Mar | Apr | May | Jun | Jul | Aug | Sep | Oct | Nov | Dec |
|---|---|---|---|---|---|---|---|---|---|---|---|---|
| 2009 | 88 | 77 | 91 | 88 | 91 | 87 | 92 | 101 | 110 | 97 | 91 | 96 |
| 2010 | 116 | 118 | 145 | 132 | 136 | 132 | 128 | 133 | 132 | 135 | 140 | 136 |
| 2011 | 140 | 126 | 141 | 138 | 143 | 153 | 152 | 156 | 146 | 172 | 189 | 162 |
| 2012 | 141 | 133 | 179 | 157 | 170 | 161 | 161 | 165 | 151 | 159 | 147 | 148 |
| 2013 | 208 | 196 | 260 | 233 | 243 | 251 | 326 | 340 | 317 | 324 | 270 | 301 |
| 2014 | 259 | 254 | 273 | 279 | 281 | 226 | 233 | 294 | 261 | 189 | 208 | 138 |
| 2015 | 185 | 181 | 261 | 231 | 198 | 265 | 244 | 264 | 267 | 240 | 244 | 268 |
| 2016 | 241 | 205 | 203 | 223 | 270 | 278 | 266 | 255 | 254 | 248 | 309 | 298 |
| 2017 | 275 | 237 | 302 | 294 | 371 | 368 | 353 | 254 | 178 | 183 | 215 | 257 |
| 2018 | 237 | 280 | 322 | 273 | 262 | 252 | 284 | 289 | 234 | 269 | 321 | 289 |
| 2019 | 336 | 317 | 369 | 347 | 386 | 431 | 413 | 419 | 366 | 282 | 174 | 539 |
| 2020 | 342 | 303 | 308 | 302 | 337 | 227 | 326 | 406 | 368 | 387 | 363 | 367 |
| 2021 | 289 | 343 | 409 | 387 | 419 | 449 | 494 | 443 | 488 | 337 | 371 | 459 |
| 2022 | 423 | 351 | 396 | 381 | 352 | 432 | 414 | 428 | 469 | 468 | 515 | 448 |
| 2023 | 407 | 394 | 514 | 314 | 442 | 626 | 256 | 570 | 489 | 379 | 303 | 275 |
| 2024 | 289 | |||||||||||
| - = No Data Reported; -- = Not Applicable; NA = Not Available; W = Withheld to avoid disclosure of individual company data. |
| Release Date: 3/29/2024 |
| Next Release Date: 4/30/2024 |