|
Download Data (XLS File) |
|
||||||||
|
||||||||
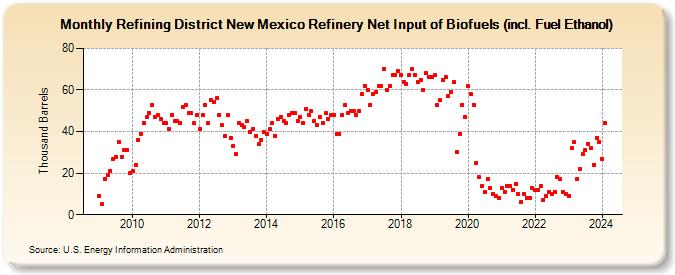
| Refining District New Mexico Refinery Net Input of Biofuels (incl. Fuel Ethanol) (Thousand Barrels) | ||||||||
| Year | Jan | Feb | Mar | Apr | May | Jun | Jul | Aug | Sep | Oct | Nov | Dec |
|---|---|---|---|---|---|---|---|---|---|---|---|---|
| 2009 | 9 | 5 | 17 | 19 | 21 | 27 | 28 | 35 | 28 | 31 | 31 | 20 |
| 2010 | 21 | 24 | 36 | 39 | 44 | 47 | 49 | 53 | 47 | 48 | 46 | 44 |
| 2011 | 44 | 41 | 48 | 45 | 45 | 44 | 52 | 53 | 49 | 49 | 44 | 48 |
| 2012 | 41 | 48 | 53 | 44 | 55 | 54 | 56 | 48 | 43 | 38 | 48 | 37 |
| 2013 | 33 | 29 | 44 | 43 | 42 | 45 | 40 | 41 | 38 | 34 | 36 | 40 |
| 2014 | 39 | 41 | 44 | 38 | 46 | 47 | 45 | 44 | 48 | 49 | 49 | 45 |
| 2015 | 47 | 44 | 51 | 48 | 50 | 45 | 43 | 47 | 44 | 49 | 46 | 48 |
| 2016 | 48 | 39 | 39 | 48 | 53 | 49 | 50 | 50 | 48 | 50 | 58 | 62 |
| 2017 | 60 | 53 | 58 | 59 | 62 | 62 | 70 | 60 | 62 | 67 | 67 | 69 |
| 2018 | 67 | 64 | 63 | 67 | 70 | 67 | 64 | 65 | 60 | 68 | 66 | 66 |
| 2019 | 67 | 53 | 55 | 65 | 66 | 57 | 59 | 64 | 30 | 39 | 53 | 47 |
| 2020 | 62 | 58 | 53 | 25 | 18 | 14 | 11 | 17 | 13 | 10 | 9 | 8 |
| 2021 | 13 | 11 | 14 | 14 | 12 | 15 | 10 | 6 | 10 | 8 | 8 | 13 |
| 2022 | 12 | 12 | 14 | 7 | 9 | 11 | 10 | 11 | 18 | 17 | 11 | 10 |
| 2023 | 9 | 32 | 35 | 17 | 22 | 29 | 31 | 34 | 32 | 24 | 37 | 35 |
| 2024 | 27 | |||||||||||
| - = No Data Reported; -- = Not Applicable; NA = Not Available; W = Withheld to avoid disclosure of individual company data. |
| Release Date: 3/29/2024 |
| Next Release Date: 4/30/2024 |