|
Download Data (XLS File) |
|
||||||||
|
||||||||
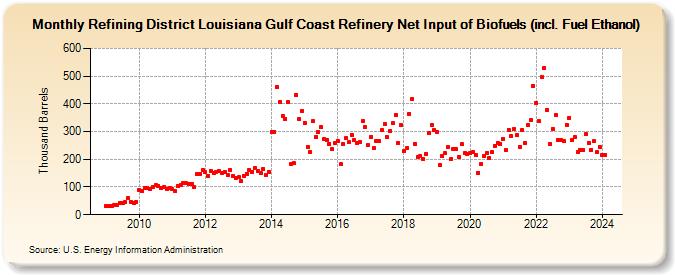
| Refining District Louisiana Gulf Coast Refinery Net Input of Biofuels (incl. Fuel Ethanol) (Thousand Barrels) | ||||||||
| Year | Jan | Feb | Mar | Apr | May | Jun | Jul | Aug | Sep | Oct | Nov | Dec |
|---|---|---|---|---|---|---|---|---|---|---|---|---|
| 2009 | 30 | 31 | 33 | 35 | 36 | 43 | 43 | 45 | 59 | 47 | 42 | 46 |
| 2010 | 89 | 86 | 98 | 97 | 94 | 100 | 106 | 104 | 95 | 99 | 92 | 97 |
| 2011 | 92 | 85 | 105 | 107 | 113 | 113 | 110 | 109 | 99 | 146 | 147 | 160 |
| 2012 | 153 | 141 | 158 | 149 | 155 | 156 | 152 | 155 | 144 | 162 | 141 | 134 |
| 2013 | 135 | 120 | 141 | 148 | 161 | 155 | 169 | 156 | 149 | 165 | 144 | 155 |
| 2014 | 299 | 300 | 462 | 406 | 356 | 347 | 405 | 184 | 186 | 433 | 346 | 375 |
| 2015 | 332 | 246 | 227 | 337 | 280 | 299 | 315 | 273 | 269 | 255 | 237 | 259 |
| 2016 | 267 | 182 | 254 | 275 | 261 | 289 | 268 | 258 | 264 | 338 | 315 | 250 |
| 2017 | 282 | 241 | 265 | 266 | 305 | 327 | 281 | 303 | 330 | 360 | 259 | 322 |
| 2018 | 229 | 240 | 365 | 418 | 256 | 209 | 211 | 201 | 220 | 294 | 325 | 305 |
| 2019 | 300 | 180 | 213 | 221 | 244 | 200 | 238 | 236 | 208 | 254 | 222 | 218 |
| 2020 | 223 | 225 | 214 | 152 | 182 | 211 | 224 | 205 | 225 | 249 | 258 | 256 |
| 2021 | 273 | 234 | 307 | 283 | 310 | 287 | 246 | 305 | 259 | 323 | 341 | 465 |
| 2022 | 404 | 338 | 496 | 529 | 379 | 256 | 311 | 360 | 268 | 269 | 265 | 325 |
| 2023 | 350 | 270 | 279 | 227 | 233 | 234 | 290 | 279 | 234 | 265 | 225 | 246 |
| 2024 | 217 | 216 | 236 | 399 | 227 | 234 | ||||||
| - = No Data Reported; -- = Not Applicable; NA = Not Available; W = Withheld to avoid disclosure of individual company data. |
| Release Date: 8/30/2024 |
| Next Release Date: 9/30/2024 |