|
Download Data (XLS File) |
|
||||||||
|
||||||||
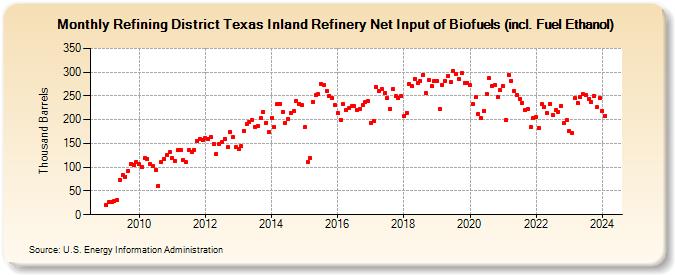
| Refining District Texas Inland Refinery Net Input of Biofuels (incl. Fuel Ethanol) (Thousand Barrels) | ||||||||
| Year | Jan | Feb | Mar | Apr | May | Jun | Jul | Aug | Sep | Oct | Nov | Dec |
|---|---|---|---|---|---|---|---|---|---|---|---|---|
| 2009 | 20 | 26 | 26 | 28 | 31 | 74 | 84 | 80 | 93 | 107 | 104 | 111 |
| 2010 | 106 | 100 | 119 | 118 | 107 | 103 | 94 | 61 | 110 | 117 | 125 | 131 |
| 2011 | 119 | 114 | 136 | 136 | 115 | 110 | 136 | 131 | 137 | 155 | 160 | 158 |
| 2012 | 161 | 159 | 163 | 149 | 128 | 149 | 154 | 160 | 142 | 175 | 163 | 142 |
| 2013 | 138 | 144 | 177 | 190 | 195 | 199 | 185 | 187 | 203 | 217 | 194 | 175 |
| 2014 | 204 | 185 | 232 | 234 | 217 | 194 | 202 | 215 | 218 | 240 | 233 | 230 |
| 2015 | 184 | 110 | 119 | 238 | 251 | 253 | 276 | 274 | 261 | 250 | 246 | 231 |
| 2016 | 214 | 200 | 233 | 220 | 224 | 228 | 229 | 221 | 223 | 230 | 238 | 239 |
| 2017 | 193 | 197 | 268 | 260 | 265 | 256 | 245 | 223 | 265 | 249 | 245 | 249 |
| 2018 | 207 | 215 | 275 | 270 | 286 | 278 | 281 | 295 | 256 | 284 | 270 | 281 |
| 2019 | 281 | 223 | 274 | 281 | 292 | 279 | 302 | 296 | 285 | 298 | 277 | 278 |
| 2020 | 272 | 233 | 247 | 212 | 203 | 219 | 255 | 287 | 271 | 273 | 248 | 262 |
| 2021 | 271 | 199 | 295 | 282 | 261 | 251 | 244 | 236 | 221 | 222 | 184 | 203 |
| 2022 | 205 | 183 | 232 | 227 | 214 | 234 | 210 | 220 | 217 | 229 | 193 | 199 |
| 2023 | 176 | 173 | 245 | 235 | 248 | 253 | 251 | 244 | 237 | 250 | 226 | 245 |
| 2024 | 218 | |||||||||||
| - = No Data Reported; -- = Not Applicable; NA = Not Available; W = Withheld to avoid disclosure of individual company data. |
| Release Date: 3/29/2024 |
| Next Release Date: 4/30/2024 |